
Page 55 - Haematologica April 2020
P. 55
Megakaryocytes modulate BM cell mobilization
ABC
D
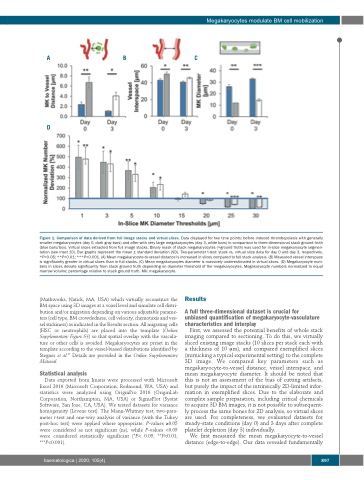
Figure 1. Comparison of data derived from full image stacks and virtual slices. Data displayed for two time points: before induced thrombopoiesis with generally smaller megakaryocytes (day 0, dark gray bars) and after with very large megakaryocytes (day 3, white bars) in comparison to three-dimensional stack ground truth (blue bars/box). Virtual slices extracted from full image stacks. Binary mask of stack megakaryocytes (=ground truth) was used for in-slice megakaryocyte segmen- tation (see inset 1C). Bar graphs represent the mean ± standard deviation (SD). Two-parameter t-test: stack vs. virtual slice data for day 0 and day 3, respectively. *P<0.05; **P<0.01; ***P<0.001. (A) Mean megakaryocyte-to-vessel distance is increased in slices compared to full stack analysis. (B) Measured vessel interspace is significantly greater in virtual slices than in full stacks. (C) Mean megakaryocytes diameter is massively underestimated in virtual slices. (D) Megakaryocyte num- bers in slices deviate significantly from stack ground truth depending on diameter threshold of the megakaryocytes. Megakaryocyte numbers normalized to equal marrow volume; percentage relative to stack ground truth. Mk: megakaryocyte.
(Mathworks, Natick, MA, USA) which virtually reconstruct the BM space using 3D images at a voxel level and simulate cell distri- bution and/or migration depending on various adjustable parame- ters (cell type, BM crowdedness, cell velocity, chemotaxis and ves- sel stickiness) as indicated in the Results section. All migrating cells (HSC or neutrophils) are placed into the template (Online Supplementary Figure S5) so that spatial overlap with the vascula- ture or other cells is avoided. Megakaryocytes are preset in the template according to the vessel-biased distributions identified by Stegner et al.15 Details are provided in the Online Supplementary Material.
Statistical analysis
Data exported from Imaris were processed with Microsoft Excel 2016 (Microsoft Corporation, Redmond, WA, USA) and statistics were analyzed using OriginPro 2016 (OriginLab Corporation, Northampton, MA, USA) or SigmaPlot (Systat Software, San Jose, CA, USA). We tested datasets for variance homogeneity (Levene test). The Mann-Whitney test, two-para- meter t-test and one-way analysis of variance (with the Tukey post-hoc test) were applied where appropriate. P-values ≥0.05 were considered as not significant (ns), while P-values <0.05 were considered statistically significant (*P< 0.05; **P<0.01; ***P<0.001).
Results
A full three-dimensional dataset is crucial for unbiased quantification of megakaryocyte-vasculature characteristics and interplay
First, we assessed the potential benefits of whole stack imaging compared to sectioning. To do this, we virtually sliced existing image stacks (10 slices per stack each with a thickness of 10 μm), and compared exemplified slices (mimicking a typical experimental setting) to the complete 3D image. We compared key parameters such as megakaryocyte-to-vessel distance, vessel interspace, and mean megakaryocyte diameter. It should be noted that this is not an assessment of the bias of cutting artifacts, but purely the impact of the intrinsically 2D-limited infor- mation in exemplified slices. Due to the elaborate and complex sample preparation, including critical chemicals to acquire 3D BM images, it is not possible to subsequent- ly process the same bones for 2D analysis, so virtual slices are used. For completeness, we evaluated datasets for steady-state conditions (day 0) and 3 days after complete platelet depletion (day 3) individually.
We first measured the mean megakaryocyte-to-vessel distance (edge-to-edge). Our data revealed fundamentally
haematologica | 2020; 105(4)
897
