
Page 56 - Haematologica April 2020
P. 56
M.G. Gorelashvili et al.
AD
B
C
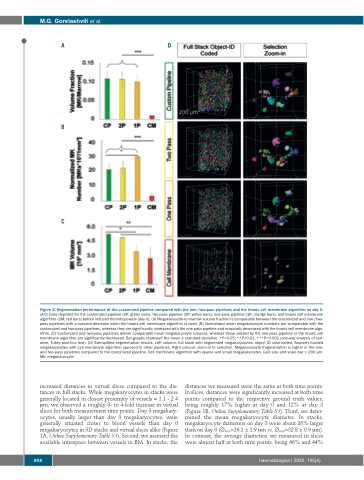
Figure 2. Segmentation performance of the customized pipeline compared with the one-/two-pass pipelines and the Imaris cell membrane algorithm on day 0.
(A-C) Data depicted for the customized pipeline (CP; green bars), two-pass pipeline (2P; yellow bars), one-pass pipeline (1P; orange bars), and Imaris cell membrane algorithm (CM; red bars) before induced thrombopoiesis (day 0). (A) Megakaryocyte-to-marrow volume fraction is comparable between the customized and one-/two- pass pipelines with a massive decrease when the Imaris cell membrane algorithm is used. (B) Normalized mean megakaryocyte numbers are comparable with the customized and two-pass pipelines, whereas they are significantly increased with the one-pass pipeline and massively decreased with the Imaris cell membrane algo- rithm. (C) Customized and two-pass pipelines deliver comparable mean megakaryocyte volumes, whereas those yielded by the one-pass pipeline or the Imaris cell membrane algorithm are significantly decreased. Bar graphs represent the mean ± standard deviation. *P<0.05; **P<0.01; ***P<0.001 (one-way analysis of vari- ance, Tukey post-hoc test). (D) Exemplified segmentation results. Left column: full stack with segmented megakaryocytes, object ID color-coded. Sparsely located megakaryocytes with cell membrane algorithm opposed to other pipelines. Right column: zoom-in to selection. Megakaryocyte fragmentation is higher in the one- and two-pass pipelines compared to the customized pipeline. Cell membrane algorithm with sparse and small megakaryocytes. Grid size and scale bar = 200 μm. Mk: megakaryocyte.
increased distances in virtual slices compared to the dis- tances in full stacks. While megakaryocytes in stacks were generally located in closest proximity of vessels ≈ 1.1 - 2.4 μm, we observed a roughly 3- to 4-fold increase in virtual slices for both measurement time points. Day 3 megakary- ocytes, usually larger than day 0 megakaryocytes, were generally situated closer to blood vessels than day 0 megakaryocytes in 3D stacks and virtual slices alike (Figure 1A, Online Supplementary Table S1). Second, we assessed the available interspace between vessels in BM. In stacks, the
distances we measured were the same at both time points. In slices, distances were significantly increased at both time points compared to the respective ground truth values, being roughly 17% higher at day 0 and 12% at day 3 (Figure 1B, Online Supplementary Table S1). Third, we deter- mined the mean megakaryocyte diameter. In stacks, megakaryocyte diameters on day 3 were about 26% larger than on day 0 (Øday0=26.1 ± 1.9 μm vs. Øday3=32.8 ± 0.9 μm). In contrast, the average diameters we measured in slices were almost half at both time points, being 46% and 44%
898
haematologica | 2020; 105(4)
