
Page 58 - Haematologica April 2020
P. 58
M.G. Gorelashvili et al.
Experimental three-dimensional image stacks serve as templates for realistic simulation of cell distribution in the bone marrow
We recently showed that segmented 3D LSFM images can be used as templates for static simulation of megakaryocyte distribution in the BM.15 Here, we system- atically compared this approach to conventional simula- tion methods. To do this, we used experimentally derived structures of megakaryocytes (MKexp) and vessels (Vexp) on the one hand, and simplified artificial structures (MKart, Vart) on the other hand. To acknowledge the complexity of
the in vivo system we employed a voxel-based simulation model using a Brownian walk with obstacles (Online Supplementary Figure S4). The artificial vasculature was constructed as a 3D lattice with correct intervascular dis- tances and megakaryocytes were spherical objects of proper size (Online Supplementary Figure S3). We combined all four possible pairs (MKartVart, MKexpVexp, MKartVexp, MKexpVart) for in silico modeling (Figure 3).
For the simulation megakaryocytes were randomly placed in the intervascular space without overlaps with vessels or other megakaryocytes (Online Supplementary
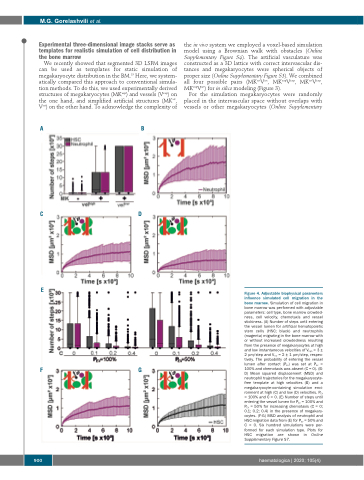
AB
CD
E
Figure 4. Adjustable biophysical parameters influence simulated cell migration in the bone marrow. Simulation of cell migration in bone marrow was performed with adjustable parameters: cell type, bone marrow crowded- ness, cell velocity, chemotaxis and vessel stickiness. (A) Number of steps until entering the vessel lumen for artificial hematopoietic stem cells (HSC; black) and neutrophils (magenta) migrating in the bone marrow with or without increased crowdedness resulting from the presence of megakaryocytes at high and low instantaneous velocities of Vhigh = 3 ± 2 μm/step and Vlow = 2 ± 1 μm/step, respec- tively. The probability of entering the vessel lumen after contact (PEV) was set at PEV = 100% and chemotaxis was absent (C = 0). (B- D) Mean squared displacement (MSD) and neutrophil trajectories for the megakaryocyte- free template at high velocities (B) and a megakaryocyte-containing simulation envi- ronment at high (C) and low (D) velocities. PEV = 100% and C = 0. (E) Number of steps until entering the vessel lumen for PEV = 100% and PEV = 50% for increasing chemotaxis (C = 0; 0.1; 0.2; 0.4) in the presence of megakary- ocytes. (F-G) MSD analysis of neutrophil and HSC migration data from (E) for PEV = 50% and C = 0. Six hundred simulations were per- formed for each simulation type. Plots for HSC migration are shown in Online Supplementary Figure S7.
FG
900
haematologica | 2020; 105(4)
