
Page 271 - Haematologica April 2020
P. 271
Inflammation and TTP
results demonstrate that a lysine-rich histone may trigger an acute episode of TTP in a13-/- zebrafish.
Generation and characterization of vwf-/- and a13-/-vwf-/- zebrafish
Lysine-rich histone is known to trigger the release of VWF from endothelial cells and enhance thrombus forma- tion after vascular injury.42 To assess the contribution of VWF in this model, we first treated cultured endothelial cells with a lysine-histone, at the concentration used in zebrafish experiments, for various times. We found that
lysine-histone induced rapid release of VWF from the cul- tured endothelial cells, which bound fluorescein-labeled platelets in whole blood from a13-/- mice under arterial flow (Online Supplementary Figure S5). We then deleted vwf from zebrafish to see if vwf-/- zebrafish were protected from the development of TTP, either spontaneously or triggered by histone. To this end, we generated a vwf-/- zebrafish line by targeting the vwf gene encoding the propeptide region using the CRISPR-cas9 (Figure 6A). A 7- bp insertion mutant of vwf was identified by Sanger sequencing (Figure 6B), which was predicted to form a
ABC
DEF
GH
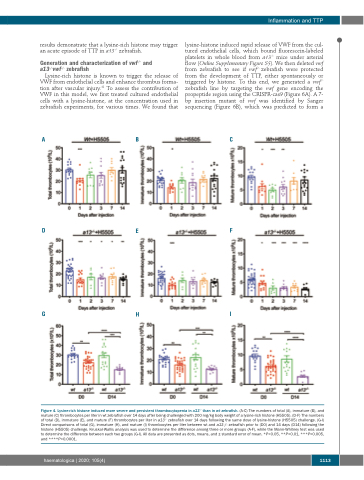
Figure 4. Lysine-rich histone induced more severe and persistent thrombocytopenia in a13-/- than in wt zebrafish. (A-C) The numbers of total (A), immature (B), and mature (C) thrombocytes per liter in wt zebrafish over 14 days after being challenged with 200 mg/kg body weight of a lysine-rich histone (H5505). (D-F) The numbers of total (D), immature (E), and mature (F) thrombocytes per liter in a13-/- zebrafish over 14 days following the same dose of lysine-histone (H5505) challenge. (G-I) Direct comparisons of total (G), immature (H), and mature (I) thrombocytes per liter between wt and a13-/- zebrafish prior to (D0) and 14 days (D14) following the histone (H5505) challenge. Kruskal-Wallis analysis was used to determine the difference among three or more groups (A-F), while the Mann-Whitney test was used to determine the difference between each two groups (G-I). All data are presented as dots, means, and ± standard error of mean. *P<0.05, **P<0.01, ***P<0.005, and ****P<0.0001.
haematologica | 2020; 105(4)
1113
I
