
Page 270 - Haematologica April 2020
P. 270
L. Zheng et al.
(Figure 5B). These results suggest that histone and/or his- tone/DNA complexes may not only be biomarkers for acute TTP, but also potential triggers for such a potentially fatal syndrome.
Histology of tissue sections revealed the presence of multiple large microvascular thrombi primarily in the liver (Figure 5C-i) and mesenteric vessels (not shown) in a13-/- zebrafish after histone challenge, but rare, small thrombi in wt zebrafish following the same treatment (Figure 5C- ii). Under unprovoked conditions, there were occasional small microvascular thrombi in a13-/- zebrafish (Figure 5C- iii), but not in wt zebrafish (Figure 5C-iv). Quantitation of microvascular thrombi in multiple stained tissue sections of various organs demonstrated that a single dose of his-
A
tone resulted in the formation of significantly more microvascular thrombi in the a13-/- than in the wt zebrafish (P<0.0001) (Figure 5D. Immunohistochemical analysis showed the presence of VWF-rich thrombi in the liver parenchyma in a13-/- zebrafish following histone challenge (Figure 5E, top). An omission of the primary antibody resulted in the complete absence of staining (Figure 5E, bottom). Agarose gel electrophoresis plus western blotting demonstrated the increased levels of plasma VWF antigen and multimer size 24 h (D1) after histone challenge in a13- /-, but not in wt zebrafish after the same histone challenge (Figure 5F). Also, consumption of ULVWF in zebrafish with acute TTP was observed between days 3-7 (Figure 5F), consistent with findings in patients.41 Together, these
BCD
EF
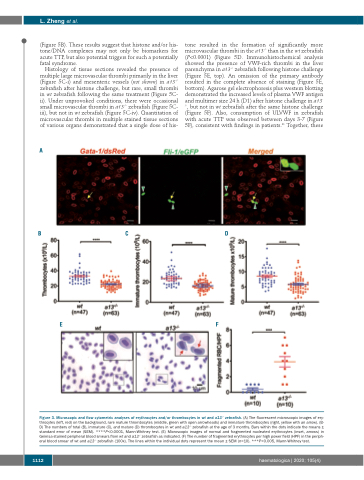
Figure 3. Microscopic and flow cytometric analyses of erythrocytes and/or thrombocytes in wt and a13-/- zebrafish. (A) The fluorescent microscopic images of ery- throcytes (left, red) on the background, rare mature thrombocytes (middle, green with open arrowheads) and immature thrombocytes (right, yellow with an arrow). (B- D) The numbers of total (B), immature (C), and mature (D) thrombocytes in wt and a13-/- zebrafish at the age of 3 months. Bars within the dots indicate the means ± standard error of mean (SEM). ****P<0.0001, Mann-Whitney test. (E) Microscopic images of normal and fragmented nucleated erythrocytes (inset, arrows) in Geimsa-stained peripheral blood smears from wt and a13-/- zebrafish as indicated. (F) The number of fragmented erythrocytes per high power field (HPF) in the periph- eral blood smear of wt and a13-/- zebrafish (100x). The lines within the individual dots represent the mean ± SEM (n=10). ***P<0.005, Mann-Whitney test.
1112
haematologica | 2020; 105(4)
