
Page 206 - Haematologica April 2020
P. 206
V. Griggio et al.
A
B
CD
G
EF
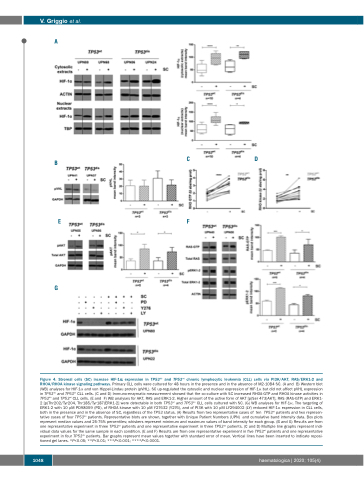
Figure 4. Stromal cells (SC) increase HIF-1α expression in TP53dis and TP53wt chronic lymphocytic leukemia (CLL) cells via PI3K/AKT, RAS/ERK1-2 and RHOA/RHOA kinase signaling pathways. Primary CLL cells were cultured for 48 hours in the presence and in the absence of M2-10B4 SC. (A and B) Western blot (WB) analyses for HIF-1α and von Hippel-Lindau protein (pVHL). SC up-regulated the cytosolic and nuclear expression of HIF-1α but did not affect pVHL expression in TP53dis and TP53wt CLL cells. (C and D) Immuno-enzymatic measurement showed that the co-culture with SC increased RHOA-GTP and RHOA kinase activities in TP53dis and TP53wt CLL cells. (E and F) WB analyses for AKT, RAS and ERK1-2. Higher amount of the active form of AKT [p(Ser 473)AKT], RAS (RAS-GTP) and ERK1- 2 [p(Thr202/Tyr204, Thr185/Tyr187)ERK1-2] were detectable in both TP53wt and TP53dis CLL cells cultured with SC. (G) WB analyses for HIF-1α. The targeting of ERK1-2 with 10 μM PD98059 (PD), of RHOA kinase with 10 μM Y27632 (Y276), and of PI3K with 10 μM LY294002 (LY) reduced HIF-1α expression in CLL cells, both in the presence and in the absence of SC, regardless of the TP53 status. (A) Results from two representative cases of ten TP53wt patients and two represen- tative cases of four TP53dis patients. Representative blots are shown, together with Unique Patient Numbers (UPN) and cumulative band intensity data. Box plots represent median values and 25-75% percentiles; whiskers represent minimum and maximum values of band intensity for each group. (B and G) Results are from one representative experiment in three TP53wt patients and one representative experiment in three TP53dis patients. (C and D) Multiple line graphs represent indi- vidual data values for the same sample in each condition. (E and F) Results are from one representative experiment in five TP53wt patients and one representative experiment in four TP53dis patients. Bar graphs represent mean values together with standard error of mean. Vertical lines have been inserted to indicate reposi- tioned gel lanes. *P<0.05; **P<0.01; ***P<0.001; ****P<0.0001.
1048
haematologica | 2020; 105(4)
