
Page 207 - Haematologica April 2020
P. 207
HIF-1α in TP53-disrupted CLL cells
AB
CD
E
FGH
IJ
K
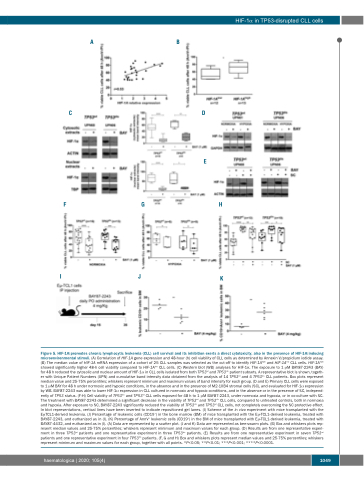
Figure 5. HIF-1α promotes chronic lymphocytic leukemia (CLL) cell survival and its inhibition exerts a direct cytotoxicity, also in the presence of HIF-1α inducing microenvironmental stimuli. (A) Correlation of HIF-1A gene expression and 48-hour (h) cell viability of CLL cells as determined by Annexin V/propidium iodide assay. (B) The median value of HIF-1A mRNA expression of a cohort of 25 CLL samples was selected as the cut-off to identify HIF-1Ahigh and HIF-1Alow CLL cells. HIF-1Ahigh showed significantly higher 48-h cell viability compared to HIF-1Alow CLL cells. (C) Western blot (WB) analyses for HIF-1α. The exposure to 1 μM BAY87-2243 (BAY) for 48 h reduced the cytosolic and nuclear amount of HIF-1α in CLL cells isolated from both TP53wt and TP53dis patient subsets. A representative blot is shown, togeth- er with Unique Patient Numbers (UPN) and cumulative band intensity data obtained from the analysis of 14 TP53wt and 4 TP53dis CLL patients. Box plots represent median value and 25-75% percentiles; whiskers represent minimum and maximum values of band intensity for each group. (D and E) Primary CLL cells were exposed to 1 μM BAY for 48 h under normoxic and hypoxic conditions, in the absence and in the presence of M2-10B4 stromal cells (SC), and evaluated for HIF-1α expression by WB. BAY87-2243 was able to lower HIF-1α expression in CLL cultured in normoxic and hypoxic conditions, and in the absence or in the presence of SC, independ- ently of TP53 status. (F-H) Cell viability of TP53dis and TP53wt CLL cells exposed for 48 h to 1 μM BAY87-2243, under normoxia and hypoxia, or in co-culture with SC. The treatment with BAY87-2243 determined a significant decrease in the viability of TP53wt and TP53dis CLL cells, compared to untreated controls, both in normoxia and hypoxia. After exposure to SC, BAY87-2243 significantly reduced the viability of TP53dis and TP53wt CLL cells, not completely overcoming the SC protective effect. In blot representations, vertical lines have been inserted to indicate repositioned gel lanes. (I) Scheme of the in vivo experiment with mice transplanted with the EμTCL1-derived leukemia. (J) Percentage of leukemic cells (CD19+) in the bone marrow (BM) of mice transplanted with the Eμ-TCL1-derived leukemia, treated with BAY87-2243, and euthanized as in (I). (K) Percentage of AnnV+ leukemic cells (CD19+) in the BM of mice transplanted with Eμ-TCL1-derived leukemia, treated with BAY87-4432, and euthanized as in (I). (A) Data are represented by a scatter plot. (J and K) Data are represented as bee-swarm plots. (B) Box and whiskers plots rep- resent median values and 25-75% percentiles; whiskers represent minimum and maximum values for each group. (D) Results are from one representative experi- ment in three TP53wt patients and one representative experiment in three TP53dis patients. (E) Results are from one representative experiment in seven TP53wt patients and one representative experiment in four TP53dis patients. (F, G and H) Box and whiskers plots represent median values and 25-75% percentiles; whiskers represent minimum and maximum values for each group, together with all points. *P<0.05; **P<0.01; ***P<0.001; ****P<0.0001.
haematologica | 2020; 105(4)
1049
