
Page 204 - Haematologica April 2020
P. 204
V. Griggio et al.
toxic effect also when TP53dis and TP53wt CLL cells were cultured for 48 h in the presence of extrinsic signals induc- ing a further upregulation of baseline levels of HIF-1α, such as hypoxia (Figure 5G and Online Supplementary Figure S6) and co-culture with SC (Figure 5H and Online Supplementary Figure S7).
To further corroborate these data and the ability of BAY87-2243 to exert effective anti-tumor functions in CLL, we used a murine model derived from the transfer of Eμ-TCL1 leukemic cells into syngeneic mice.17 In line with the results reported by Valsecchi et al.,17 showing that HIF-1α regulates the interaction of CLL cells with the bone marrow (BM) microenvironment, we observed that
BAY87-2243 significantly reduced BM infiltration by leukemic cells, also inducing cytotoxicity in a consistent proportion of CLL cells (Figure 5I-K). The anti-tumor effect observed with BAY87-2243 in the BM was not evi- dent in the PB and spleen compartments (data not shown), suggesting that, in a murine model of aggressive and rap- idly growing CLL, HIF-1α may serve as a pro-survival fac- tor, especially for the leukemia reservoir residing in the BM.
In conclusion, our data indicate that HIF-1α is a pro-sur- vival factor in CLL, which can be effectively targeted by the pharmacologic agent BAY87-2243, a specific inhibitor with potent anti-tumor effects both in vitro and in vivo.
A
B
C
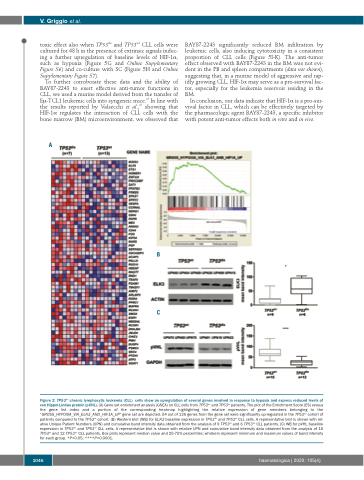
Figure 2. TP53dis chronic lymphocytic leukemia (CLL) cells show an upregulation of several genes involved in response to hypoxia and express reduced levels of von Hippel-Lindau protein (pVHL). (A) Gene set enrichment analysis (GSEA) on CLL cells from TP53dis and TP53wt patients. The plot of the Enrichment Score (ES) versus the gene list index and a portion of the corresponding heatmap highlighting the relative expression of gene members belonging to the “GROSS_HYPOXIA_VIA_ELK3_AND_HIF1A_UP” gene set are depicted. 54 out of 126 genes from the gene set were significantly up-regulated in the TP53dis cohort of patients compared to the TP53wt cohort. (B) Western blot (WB) for ELK3 baseline expression in TP53dis and TP53wt CLL cells. A representative blot is shown with rel- ative Unique Patient Numbers (UPN) and cumulative band intensity data obtained from the analysis of 9 TP53wt and 6 TP53dis CLL patients. (C) WB for pVHL baseline expression in TP53dis and TP53wt CLL cells. A representative blot is shown with relative UPN and cumulative band intensity data obtained from the analysis of 15 TP53wt and 12 TP53dis CLL patients. Box plots represent median value and 25-75% percentiles; whiskers represent minimum and maximum values of band intensity for each group. *P<0.05; ****P<0.0001.
1046
haematologica | 2020; 105(4)
