
Page 203 - Haematologica April 2020
P. 203
HIF-1α in TP53-disrupted CLL cells
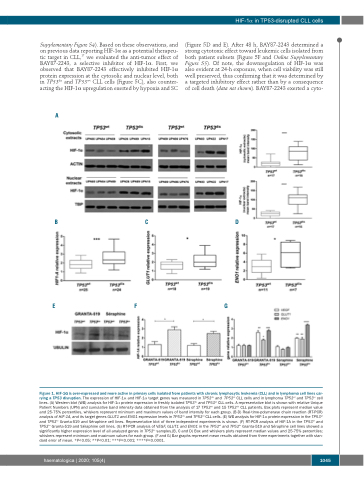
Supplementary Figure S4). Based on these observations, and on previous data reporting HIF-1α as a potential therapeu- tic target in CLL,17 we evaluated the anti-tumor effect of BAY87-2243, a selective inhibitor of HIF-1α. First, we observed that BAY87-2243 effectively inhibited HIF-1α protein expression at the cytosolic and nuclear level, both in TP53dis and TP53wt CLL cells (Figure 5C), also counter- acting the HIF-1α upregulation exerted by hypoxia and SC
A
(Figure 5D and E). After 48 h, BAY87-2243 determined a strong cytotoxic effect toward leukemic cells isolated from both patient subsets (Figure 5F and Online Supplementary Figure S5). Of note, the downregulation of HIF-1α was also evident at 24-h exposure, when cell viability was still well preserved, thus confirming that it was determined by a targeted inhibitory effect rather than by a consequence of cell death (data not shown). BAY87-2243 exerted a cyto-
BCD
EFG
Figure 1. HIF-1α is over-expressed and more active in primary cells isolated from patients with chronic lymphocytic leukemia (CLL) and in lymphoma cell lines car- rying a TP53 disruption. The expression of HIF-1α and HIF-1α target genes was measured in TP53dis and TP53wt CLL cells and in lymphoma TP53wt and TP53ko cell lines. (A) Western blot (WB) analysis for HIF-1α protein expression in freshly isolated TP53dis and TP53wt CLL cells. A representative blot is shown with relative Unique Patient Numbers (UPN) and cumulative band intensity data obtained from the analysis of 17 TP53wt and 15 TP53dis CLL patients. Box plots represent median value and 25-75% percentiles, whiskers represent minimum and maximum values of band intensity for each group. (B-D) Real-time-polymerase chain reaction (RT-PCR) analysis of HIF-1A, and its target genes GLUT1 and ENO1 expression levels in TP53dis and TP53wt CLL cells. (E) WB analysis for HIF-1α protein expression in the TP53wt and TP53ko Granta-519 and Séraphine cell lines. Representative blot of three independent experiments is shown. (F) RT-PCR analysis of HIF-1A in the TP53wt and TP53ko Granta-519 and Séraphine cell lines. (G) RT-PCR analysis of VEGF, GLUT1 and ENO1 in the TP53wt and TP53ko Granta-519 and Séraphine cell lines showed a significantly higher expression level of all analyzed genes in TP53ko samples.(B, C and D) Box and whiskers plots represent median values and 25-75% percentiles; whiskers represent minimum and maximum values for each group. (F and G) Bar graphs represent mean results obtained from three experiments together with stan- dard error of mean. *P<0.05; **P<0.01; ***P<0.001; ****P<0.0001.
haematologica | 2020; 105(4)
1045
