
Page 103 - Haematologica March 2020
P. 103
Role of PIEZO1 during human erythropoiesis
C
D
(n=3), HX#2 (n=3), and HX#10(n=3)] were used; CD34+ cells were sorted and cultured in erythroid medium. Alternatively, for nine non-phlebotomized patients, MNC were purified from 12 blood samples and were grown directly in the same medium. For controls, we used mag- netically sorted CD34+ cells from mobilized peripheral blood MNC (n=5), and MNC from healthy control blood samples (n=9). At day 10, we observed a clear delay in ery- throid differentiation for seven of the ten PIEZO1-HX mutations (8/14 patients), as shown by a decrease in mature CD71+/GPAHigh cells (Figure 7A from sorted CD34+ cells and 7B from MNC). A moderate but visible delay
was observed for the three other PIEZO1-HX mutations (6/14 patients). The intensity of the phenotype was het- erogeneous from one mutation to another (Figure 7B), but was reproducible for a given mutation (Figure 7A). For one patient (HX#1), MNC and CD34+ cells were cultured in parallel and a similar phenotype was observed (one repre- sentative dot plot is shown Figure 7C). Cytological analy- ses after staining with May-Grünwald-Giemsa performed in triplicate for this patient confirmed the delayed ery- throid differentiation, showing accumulation of immature erythroblasts (Figure 7D, E). MFC data for all HX muta- tions and controls are shown in Online Supplementary
AB
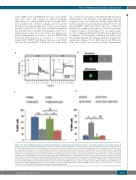
Figure 5. The effect of PIEZO1 activation on erythroid differentiation is calcium-dependent but does not involve a secondary activation of the Gardos channel. (A and B) Cells were incubated with Fluo4-AM for 30 min before stimulation with 5 mM YODA1. (C and D) UT7/EPO cells were cultured for 72 h after drug stimulation. (A) YODA1 stimulation caused a dose-dependent increase in cytosolic calcium concentration in a calcium-containing medium (+Ca2+, right panel). No effect was seen in a calcium-free medium (-Ca2+, left panel). YODA1 stimulation (“Y”) was performed 60 s after the baseline recording (“B”), before recording for 300 s. The YODA1 concentration was 1 mM (solid line), 10 mM (dashed line), or 20 mM (dotted line). The positive control for an intracellular Ca2+ increase was stimulation with 1 mM ionomycin (“I”) recording for 300 s. The image shown here is representative of three identical experiments. (B) Image of intracellular Ca2+ content assessed by ImageStreamX using Fluo4-AM cell permeant, after stimulation with 20 mM YODA1 in Ca2+-containing (lower panel) or Ca2+-free (upper panel) medium. (C) In UT7/EPO cells, exposure to 5 mM YODA1 decreased glycophorin A (GPA) expression (35±1.4%) compared to the expression following exposure to dimethylsulfoxide (DMSO) (77±2%). Extracellular Ca2+ chelation using 2 mM ethylene glycol tetra-acetic acid (EGTA) prevented the GPA decrease due to YODA1 (70±7%), and the effect was rescued by adding 2 mM extra calcium chloride (31±2%). (D) Co-exposure with 4 mM Senicapoc, a selective Gardos channel inhibitor, did not block the GPA decrease (13±1%) due to YODA1 stimulation (10±8%, P=NS) in erythropoietin (EPO)-containing medium, compared to DMSO (56±3%). (n=3 for all experiments; ***P<0.001; **P<0.01; *P<0.05). GMCSF: granulocyte-macrophage colony-stimulating factor.
haematologica | 2020; 105(3)
617
