
Page 101 - Haematologica March 2020
P. 101
Role of PIEZO1 during human erythropoiesis
compared to DMSO (Figure 6B, C, and Online Supplementary Figure S7A). These data argue for a role of the PIEZO1/Ca2+/NFAT pathway in the control of ery- throid differentiation. We also tested whether the main transduction pathways associated with EPO signaling were involved. We used a strategy based on: (i) protein
phosphorylation measurements after stimulation with YODA1 and/or cytokines in cell lines and primary cells and (ii) chemical inhibitors, assuming that inhibition of any pathway downstream of PIEZO1 would revert the YODA1-mediated phenotype. We tested two main path- ways: ERK1/2 and STAT5. The phospho-ERK inhibitor
AB
CD
E
F
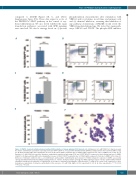
Figure 3. PIEZO1 chemical activation delayed erythroid differentiation of human primary CD34+-derived cells. (A) Exposure to 1 mM YODA1 for 3 days decreased the mature erythroblastic population expressing CD71 and GPAHigh [8±4% vs. 60±12% with dimethylsulfoxide (DMSO)]: multiparametric flow cytometry (MFC) at day 10. (B) Representative MFC plots showing the decrease in the CD71+/GPAHigh population due to YODA1 (right) compared to the effect of DMSO (left), at day 10. (C) Exposure to 1 mM YODA1 increased the immature erythroblastic population expressing CD36 and CD117 (85±5%) compared to that following exposure to DMSO (36±11%). (D) Representative MFC plots showing the increase in CD36+/CD117+ population due to YODA1 (right) compared to that due to DMSO (left), at day 10. (E) Excess of immature erythroid cells, i.e., proerythroblasts and basophilic erythroblastsb upon exposure to YODA1 compared to exposure to DMSO, assessed by cytology after May-Grünwald-Giemsa (MGG) staining (96±5% vs. 63±6%). (F) Representative cytology after MGG staining at day 10 of in vitro erythroid differentiation showing a heterogeneous population of erythroblasts at all stages of maturation including the orthrochromatic (*) stage in the control (left) compared to a more homogeneous population of immature erythroblasts in the presence of 1 mM YODA (right). (n=4 in experiment E, n=3 in all other experiments). ***P<0.001; **P<0.01 ; *P<0.05.
haematologica | 2020; 105(3)
615
