
Page 104 - Haematologica March 2020
P. 104
A. Caulier et al.
ABC
DEF
G
H
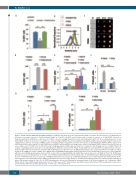
Figure 6. YODA1 activates NFAT, ERK and STAT5 pathways in erythroid cells. (A) The decrease in glycophorin A (GPA) in UT7/EPO cells after exposure to 5 μM YODA1 was blocked by concomitant exposure to 5 mM tacrolimus (32±8% vs. 70±2.5%). (B) NFAT nuclear translocation secondary to exposure to 10 mM YODA1, assessed on ImageStream®X by the similarity score (SS) value in UT7/EPO cells, after overnight starvation of serum and erythropoietin (EPO). The SS is a mathematical tool used in Amnis IDEAS software to assess the co-localization of a fluorescent signal (NFATc1-PE) and 4′,6-diamidino-2-phenylindole (DAPI) nuclear staining. A high SS value means a highly translocated state. (C) Images of NFATc1 cellular localization using live imaging flow cytometry. After exposure to dimethylsulfoxide (DMSO), NFATc1 was preferen- tially localized in the cytosol, whereas 10 mM YODA1 increased NFATc1 nuclear translocation. Images were extracted from Amnis IDEAS software for mean SS values of each condition. (D) In UT7/GM cells, 10 mM UO126 induced high glycophorin A (GPA) expression (94±0.2%) compared to that following exposure to DMSO (18±2%) in medium containing granulocyte-monocyte colony-stimulating factor (GMCSF), and reverted the YODA1-mediated GPA repression when EPO was added (86±1%). Cells were incubated with UO126 for 30 min before stimulation with 5 mM YODA1, then cultured for 72 h. (E) ERK phosphorylation assessed by PhosphoFlow in UT7/GM cells. Values shown are the p-ERK ratio relative to DMSO alone. GMCSF induced mild ERK phosphorylation (x1.65±0.27) whereas 10 U/mL EPO did not (x1.06±0.1, P=NS). YODA1 (10 mM) induced strong ERK phosphorylation (x3.96±0.581), an effect that was markedly inhibited by 2 mM ethylene glycol tetra-acetic acid (EGTA) (x1.71±0.05). (F) ERK phos- phorylation assessed by PhosphoFlow in UT7/EPO cells. Sh-RNA-mediated PIEZO1 knockdown inhibited the 10 mM YODA1-induced ERK phosphorylation (fold P-ERK increase in Sh-SCR-transduced cells: x2.93±0.2; in Sh-PIEZO1-transduced cells: x1.13±0.1). (G) ERK phosphorylation assessed by PhosphoFlow in primary human CD34+- derived erythroid cells. YODA1 did not induce ERK phosphorylation (x1.04±0.16, P=NS), whereas 5 U/mL EPO did moderately (x1.49±0.4). YODA1 synergized with EPO to induce ERK phosphorylation (x3.21±0.62). (H) STAT5 phosphorylation assessed by PhosphoFlow in primary human CD34+-derived erythroid cells. Compared to DMSO, YODA1 did not induce STAT5 phosphorylation (x1.03±0.09, P=NS), whereas EPO did (x9.6±2.4), and YODA1 enhanced EPO-driven STAT5 phosphorylation (x19.6±1.9). (n=3 in A and D, and n=4 in all other experiments); ***P<0.001 ; **P<0.01; *P<0.05
618
haematologica | 2020; 105(3)
