
Page 51 - 2019_12-Haematologica-web
P. 51
Disruption of MBD2-NuRD induces high HbF levels
A
BC
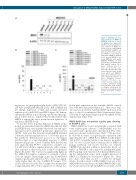
Figure 3. CRISPR/Cas9 medi- ated knockout of MBD3 in HUDEP-2 cells has no effect on g-globin gene expression. (A) Western blot showing com- plete depletion of MBD3 pro- tein in 5 out of 7 independent clonal MBD3KO HUDEP-2 cell lines, (B and C) Plots of g-glo- bin mRNA as a percentage of total globin mRNA by qRT-PCR in the pooled MBD2KO, five clonal MBD3KO, and pooled MBD3KO HUDEP-2 cell lines compared to scrambled guide RNA (sgSCR) controls. (B) y- axis is continuous from 0 to 100% g/g+β. (C) The same data with a break in the y-axis and zoomed in to more clearly show sgSCR and MBD3KO data points. Error bars repre- sent ± Standard Deviation of three biological repeats. *P<0.05; **P<0.01; n.s.: P>0.05 between sample and scramble. Statistical testing was performed using analysis of variance followed by the Tukey’s honestly significant dif- ference procedure post-hoc test.
globin gene expression in the scramble shRNA controls across the three time points (Figure 2C). There was a step- wise increase in relative g-globin mRNA expression from day 4 to day 10 of expansion (Online Supplementary Figure S5A) with no significant change in β-globin mRNA (Online Supplementary Figure S5B).
MBD3-NuRD does not mediate g-globin gene silencing in HUDEP-2 cells
MBD3-NuRD has been biochemically associated with some g-globin gene silencers.39,40 MBD3-NuRD was also associated with g-globin gene silencing in β-YAC trans- genic mice in some studies but not others.34,35 We previous- ly observed no effect on g-globin gene expression after approximately 75% siRNA Kd of MBD3 in CID-depen- dent β-YAC containing murine bone marrow progenitor cells.27 As we could not achieve sufficient Kd of MBD3 in human erythroid cell model systems, we utilized CRISPR/Cas9 genomic editing to genetically knock out MBD3 in HUDEP-2 cells using two independent guide RNA targeting exon 3 and exon 5 of human MBD3, isolat- ing five independent clones with complete knockout of MBD3 as confirmed by western blot (Figure 3A). These five clones were then pooled to control for off-target effects. In stark contrast to KO of MBD2, four out of five MBD3KO clones and the pooled MBD3KO HUDEP-2 line showed no increase in g-globin mRNA as a percent of total
ing factors, we measured protein levels of LRF, BCL11A, and KLF1 in MBD2KO HUDEP-2 cells. KO of MBD2 did not change expression of LRF, and actually increased expression of both BCL11A and KLF1 (Figure 1F), demon- strating that MBD2 is not silencing g-globin through regu- lation of these factors. Together these results indicate that MBD2 is among the most potent known repressors of g-globin in HUDEP-2 cells.
To test the effect of partial depletion of MBD2 in this model, we performed lentiviral shRNA Knockdown (Kd) in HUDEP-2 cells, and quantified the levels of β and g-glo- bin expression by quantitative polymerase chain reaction (qPCR). Cells were first transduced with shRNA lentiviral constructs and then expanded for 4, 7, or 10 days prior to the erythroid differentiation protocol to investigate whether there is a time-dependent response to MBD2 depletion (Figure 2A). Levels of MBD2 RNA knockdown were approximately 80-90% compared to scramble con- trol cells across all three expansion periods with a compa- rable response at the protein level at day 4 of expansion (Figure 2B and D). The %g/g+β was significantly higher in the MBD2 Kd samples compared to scramble controls across all samples. Interestingly, in the day 10 MBD2 Kd sample, g-globin gene induction (30% g/g+β) was signifi- cantly higher than the day 4 MBD2 Kd sample (19% g/g+β), and the level in the day 7 sample was intermediate at approximately 25% g/g+β, compared to no change in g-
haematologica | 2019; 104(12)
2365
