
Page 50 - 2019_12-Haematologica-web
P. 50
X. Yu et al.
A
BC
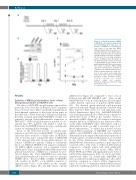
D degree of MBD2 protein knockdown at the day-4 time point. (C) Time-course plot of g-globin mRNA as a percentage of total globin mRNA by qRT-PCR at the indicated time points. (D) Relative MBD2 mRNA expression normalized by cyclophilin A compared to the shSCR sample by quan- titative real-time polymerase chain reac- tion at four, seven, and ten-day time points. Error bars represent ± Standard Deviation of three biological repeats. *P<0.05; **P<0.01; n.s.: P>0.05 between sample and scramble. Statistical testing was performed using
Figure 2. Lentiviral knockdown of MBD2 in HUDEP-2 cells results in progressively increased g-globin gene expression. (A) Schema of HUDEP-2 cell expansion for four, seven, or ten days after MBD2 shRNA lentiviral transduction, prior to a 3- day differentiation period. mRNA and pro- tein were harvested after the expansion and differentiation period for all samples. (B) Western blot showing qualitative
the Student’s t-test.
Results
mRNA levels (Figure 1C) comparable to those seen in BCL11A and LRF KO HUDEP-2 cells.13 None of the MBD2KO clones or the pooled population showed signif- icantly different expression of β-globin mRNA (Figure 1D). We observed greatly increased g-globin protein expression with little change in β-globin, consistent with their respective RNA levels for each individual clone (Online Supplementary Figure S1A). MBD2KO HUDEP-2 cells made approximately 38% HbF protein compared to undetectable levels of HbF in the scramble control as measured by HPLC (Figure 1E). We wished to investigate whether knockout of MBD2 had any deleterious effects on the ability of HUDEP-2 cells to differentiate, such as a differentiation block or a shift to an earlier stage of ery- throid differentiation. To address this question, we per- formed RNA-sequencing of MBD2KO and scrambled sgRNA control HUDEP-2 cells before and after erythroid differentiation and compared the differential expression of 15 marker genes of erythroid differentiation, as described in the Online Supplementary Methods. Interestingly, MBD2KO cells demonstrate a pattern of gene expression consistent with a later stage of erythroid differentiation compared to scramble control cells, with significantly higher levels of GYPA, SLC4A1, ALAS2, EPB42, SPTA1, FECH, EPOR, and UROS, and significantly lower levels of CD44 (Online Supplementary Tables S2 and S3 and Online Supplementary Figure S2). Additionally, MBD2KO cells have an unaltered morphological appearance after differ- entiation compared to controls (Online Supplementary Figures S3 and S4). To determine whether MBD2 silences g-globin by regulating expression of known potent silenc-
Depletion of MBD2 greatly increases levels of fetal hemoglobin production in HUDEP-2 cells
The effect of MBD2 KO on g-globin gene expression has previously been described in human β-YAC transgenic mice;32 however, mice differ considerably from humans in developmental regulation of the β-type globin genes in that they lack a direct homolog to human fetal g-globin. Recently, a human immortalized HUDEP-2 cell line was generated through doxycycline-inducible expression of HPV E6/E7.17 With a β/g-globin expression profile of <1% g-globin and >95% β-globin, very similar to adult ery- throid cells, the HUDEP-2 line has become a useful model system for studying globin switching.11,13,38
Based on the 10-20-fold increase in g-globin gene expression in β-YAC mice lacking MBD2,32 we hypothe- sized that there would be a similar effect in HUDEP-2 cells. To test this and to compare the effect of MBD2 KO to that observed with other strong g-globin silencers, we utilized CRISPR/Cas9 genome editing to biallelically knock out MBD2 in HUDEP-2 cells using two independ- ent MBD2 sgRNA sequences and a scrambled control sgRNA guide. Three independent MBD2 KO clones were generated and absence of MBD2 was confirmed by west- ern blot (Figure 1A). These MBD2KO clones were then analyzed individually and as pools to control for off-target CRISPR effects. Knockout (KO) of MBD2 in HUDEP-2 cells resulted in 40-55% g/g+β mRNA compared to approximately 0.15% g/g+β mRNA in the scramble sgRNA controls (Figure 1B), and high relative g-globin
2364
haematologica | 2019; 104(12)
