
Page 49 - 2019_12-Haematologica-web
P. 49
Disruption of MBD2-NuRD induces high HbF levels
conducted in the VCU Health System clinical lab using a Clinical Laboratory Improvement Amendments certified protocol with standard controls.
Nuclear magnetic resonance
Uniform 13C, 15N labeled wild-type and mutant (R286E/L287A) MBD2 IDR were expressed and purified as described previously.25 The purified proteins were buffer exchanged into nuclear magnet- ic resonance (NMR) buffer (10 mM NaPO4, pH 6.0, 0.02% sodium azide, 1 mM dithiothreitol, and 10% 2H2O, 0.5-1 mM protein) and spectra collected on a Bruker Avance III 700 MHz instrument at 25oC. Assignments for the wild-type (WT) protein at pH 6.5,
reported previously,25 were extended to the WT and mutant sam- ples at pH 6.0 using standard double and triple resonance experi- ments [15N-HSQC, HNCO, HNCACB, HBHA(CO)NH, 15N-NOESY-HSQC], which were processed and analyzed with NMRPipe36 and CcpNmr,37 respectively.
Statistical analysis and data sharing
All experiments were carried out in at least three independent biological repeats. Statistical significance between groups within experiments were determined as described in the figure legends. Sequencing data are available at the NCBI Gene Expression Omnibus (GEO accession number: GSE121992).
AB
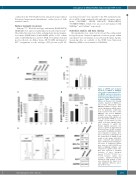
knockout of MBD2 in HUDEP-2 CD cells results in approximately 50% g/g+β RNA expression and propor- tionally increased the fold effect on fetal hemoglobin (HbF) by high per- formance liquid chromatography (HPLC). (A) Western blot showing complete depletion of MBD2 pro- tein in three independent clonal MBD2KO HUDEP-2 cell lines. (B-D) Levels of globin gene mRNA expres- sion by qualitative polymerase chain reaction in the three clonal MBD2KO and pooled MBD2KO HUDEP-2 cell lines compared to scrambled guide RNA (sgSCR) con- trols. (B) g-globin mRNA as a per- centage of total globin (g/g+β%) mRNA. (C) Relative γ-globin expres- sion compared to sgSCR. (D) Relative β-globin expression com- pared to sgSCR (E) Approximately 40-fold increase in HbF as meas- ured by HPLC in MBD2KO HUDEP-2 cells compared to scramble. Note that a monoallelic polymorphism in the g-globin gene of HUDEP-2 cells results in two distinct HbF HPLC peaks, consistent with published data.17 (F) Western blot showing pro- tein levels of established g-globin gene silencers (LRF, BCL11A and KLF1) in MBD2KO HUDEP-2 cells compared to sgSCR control cells. Error bars represent ± Standard Deviation of three biological repeats. *P<0.05; **P<0.01; n.s.: P>0.05 between sample and scramble. Statistical testing was performed using analysis of vari- ance followed by the Tukey’s hon- estly significant difference proce-
EF
Figure 1. CRISPR Cas9 mediated
dure post-hoc test.
haematologica | 2019; 104(12)
2363
