
Page 100 - 2019_12-Haematologica-web
P. 100
A.L. Young et al.
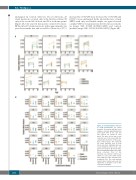
unchanged. In controls with two blood collections, 27 clonal mutations occurred only at the first blood draw, 58 only at the second blood draw, and 29 at both time points (Figure 2A; blue and red data points connected by lines). Of the latter 29 clonal mutations, in the approximately ten years between the first and second blood draw, five (17%)
A
increased by >0.01 VAF, none decreased by >0.01 VAF, and 24 (83%) were unchanged. In the 22 matched sets of men (HPFS) with only one banked sample, we again observed a similar VAF for clonal mutations detected in cases [medi- an (range) VAF: 0.0020 (0.0002-0.3280)] and controls [median (range) VAF: 0.0014 (0.0002-0.3513)] (Figure 2B).
B
Figure 2. Clonal mutations detected in study participants. (A) Clonal dynamics for women with two blood samples collected approximately ten years apart. Trios of one case and two controls are shown in each panel. The ages at first and second collection are on the x-axis while the variant allele fraction is on the y-axis. Dots connected by a line represent the same mutation seen in both blood collections. Individual dots rep- resent mutations only seen in a sin- gle blood collection. (B) Clonal muta- tions for individuals with only a single blood collection. Trios of one matched case and two controls are shown in each panel with female trios numbered <100 and male trios numbered >100. The y-axis portrays variant allele fraction and each dot represents a mutation seen in the respective individual.
2414
haematologica | 2019; 104(12)
