
Page 102 - 2019_12-Haematologica-web
P. 102
A.L. Young et al.
A
B
C
samples, we did not observe clonal expansion over ten years and found no evidence among the AML cases that the most abundant clone at either an early or late time point, or the largest difference in VAF between time points for any clone, correlated with time to AML onset. Similarly, neither of the previous studies observed differ- ences in clonal expansion in individuals with serial sam- ples who did or did not eventually develop AML.4,5 However, Desai et al.4 observed striking differences in time to AML diagnosis for individuals with any baseline muta- tion and noted that the degree of diminished latency var- ied by mutation and clonal complexity. With our smaller sample size, we lacked resolution to perform as detailed an analysis of mutational complexity of clonal hematopoiesis, or of temporal changes, as the prior larger studies. Nonetheless, our findings extended, by several years, the pre-diagnosis period during which detection of clonal hematopoiesis could be informative for identifying individuals at an increased risk for AML.
Notably, we observed relatively similar VAF of clonal hematopoietic mutations in cases and controls, whereas the Abelson et al. and Desai et al. studies4,5 reported more striking differences in the overall VAF and mutational complexity of CHIP in cases and controls. The explanation for these discrepancies is not immediately clear, although differences in methodology for control matching or differ- ing average lengths of follow up across the three studies may have contributed. In the present study, we did not have sufficient sample size to compare mutational profiles of cases versus controls within more proximal and more distal follow-up periods, but it is plausible that contrasts in clonal hematopoiesis profiles between individuals who do and do not progress may deepen as diagnosis of malignan- cy approaches.
Our observation of an increased risk of AML in individ- uals with variants at the DNMT3A R882 locus is unsur- prising, given the prevalence of DNMT3A R882 hotspot mutations in AML,15 but also highlights that different mutations in the same gene do not convey the same risk and should not be viewed as equivalent a priori. Of inter- est, one of the few other individual variants that occurred relatively frequently in the present study sample, DNMT3A W860R, occurred more commonly in controls than in cases. This raises the question as to whether the aggregation of variable mutations across any single gene is appropriate to evaluate true AML risk. Larger studies with sufficient statistical power to examine individual muta- tions at varying VAF (and, perhaps, combinations of indi- vidual variants) may prove informative for further refining the interpretation of clonal hematopoiesis for stratifying risk of AML.
The strengths of this research include studying two large, well-characterized population-based cohorts with many years of follow up after blood collection. We matched cases and controls carefully on potential con- founding variables including age, ethnicity, sex, and date(s) of blood collection and utilized conditional logistic regression for efficient control of confounding by those variables in the analysis. Further, for a subset of women in the NHS, we explored and compared temporal changes in clonal hematopoiesis over an approximately 10-year inter- val in those who did or did not subsequently develop AML. We conducted ECS assays and ddPCR validation in a blinded manner and observed strong reproducibility of variant calls across orthogonal platforms, affirming the
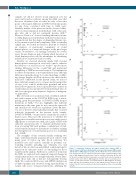
Figure 3. Comparison between the largest variant allele fraction (VAF) or largest change in VAF per individual with acute myeloid leukemia (AML) (x-axis) and the time to AML diagnosis (y-axis). (A) The VAF for the most common muta- tion observed in a first or only blood collection sample is plotted relative to the time to AML diagnosis from the date of first or only blood collection. (B) The VAF for the most common mutation observed in a second blood collection sample is plotted relative to the time to AML diagnosis from the date of second blood col- lection. (C) The time from the second blood draw to AML diagnosis in partici- pants with two blood samples, based on the largest observed increase in VAF between the first and second blood collections (regardless of the corresponding variant).
2416
haematologica | 2019; 104(12)
