
Page 88 - 2019_11 Resto del Mondo-web
P. 88
J.R. Cursino-Santos et al.
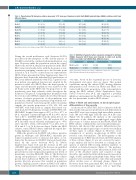
Table 3. Parasitemia of B. divergens cultures measured 1-72 hours post invasion in sickle trait (HbAS) and wild-type (HbAA) red blood cells from different donors.
Sample 1h 24h 48h 72h
HbAA-V 4.5 [0.50]
HbAA-VI 3.8 [0.22]
HbAA-VII 3.3 [0.12]
HbAS-1 2.8 [0.04]
HbAS-2 3.1 [0.01]
HbAS-3 3.6 [0.03]
HbAS-4 4.9 [0.03]
HbAS-5 3.9 [0.11]
Parasitemia values in percentage average. [StDv]: Standard Deviation among triplicates; h: hours.
8.7 [0.15]
26.7 [0.82]
26.7 [0.38] 26.0 [0.26] 23.8 [1.01] 16.9 [0.32] 22.2 [0.06] 23.6 [0.10] 21.2 [0.12]
43.1 [2.35]
47.2 [1.25] 48.2 [0.70] 41.8 [3.35] 41.8 [2.95] 44.7 [1.04] 47.4 [2.35] 45.8 [1.50]
7.7 [0.15] 7.6 [0.21] 6.7 [0.23] 6.1 [0.06] 7.5 [0.17] 8.4 [0.00] 7.4 [0.00]
During the second proliferative cycle (between 24-48 h post invasion) the emergence of >4N- and the increase of 4N-iRBC revealed the continued cellular proliferation over time. However, unlike the population seen in the control HbAA cells after 24 h, the parasite population in the HbSS RBC turned structurally stable, with the frequency of sub- populations remaining constant up to the last time point assayed at 72 h. The set of data from four representative HbSS cultures presented in Online Supplementary Figure S1 illustrates that, despite the individual biological features of RBC from different individuals with SCD, a general com- mon pattern of population structure was adopted by the parasite in sickle cells (HbSS). Once the heterogeneity of stages and sub-parasite populations was achieved at the 24 h time point in the HbSS cells, the proportion of sub- populations were kept relatively stable throughout the monitored 72 h period. Comparing these frequencies with those from control HbAA samples showed that the main- tenance of relative proportions of sub-populations was not random. Although the parasitemia along with the sub- population structure varied among the sickle cell anemia samples, the specific proportions of 1N-, 2N-, 4N- and >4N-iRBC were built in the 11 samples that stayed con- stant from 24-72 h [frequency averages in HbSS iRBC: 1N- HbSS-iRBC dropped from approx. 68% at 1 h to 47% at 24 h; remained constant throughout 48 h as 44% and at 72 h as 51%; 2N-HbSS-iRBC from the initial 26% at 1 h slightly changed to 28% up to 72 h; 4N reached 20% at 24 h and then stayed relatively unchanged up to 48 h (21%) and 16% (72 h); >4N reached 7% at 24 h, 10% at 48 h and 5 % at 72 h] (data not shown). Unlike the HbSS cultures, control HbAA cultures exhibited the typical fluc- tuating dynamics of parasite culture.
Unlike the parasites in the HbSS cell cultures, parasites grown in wild-type cells (HbAA-RBC) efficiently per- formed sequential cycles of invasion and egress, as evi- denced by the increase in 1N-iRBC (invasion clearly iden- tified by the arrow between 48-72 h) (Online Supplementary Figure S1A) and the decrease in 4N- and >4N-iRBC (egress identified by the decrease in quantified frequency 4N- and >4N-iRBC; data not shown) with a pro- gressive increase in total parasite population size (levels of parasitemia over time HbAA-III; Table 2). This fluctuation among sub-populations of parasites in HbAA cultures proved that conditions in HbAA cells were conducive to parasite life-cycle processes that resulted in population growth. Similarly, parasite cultures in HbAS cells exhibit- ed the variation in infected RBC-sub populations expected
Table 4. Inhibition of parasite culture expansion compared to wild-type (HbAA) measured 24-72 hours post invasion in sickle cell anemia (HbSS) and sickle trait (HbAS) from different donors.
Sample 24h 48h 72h
HbSS (n=12) 22 [19] 69 [12] 84 [8]
HbAS (n=6) 10 [8] 15 [11] 4 [4]
Values expressed as average percentage of inhibition compared to control HbAA [StDv]: Standard Deviation among triplicates; h: hours.
over time, based on the sequential process of invasion, development and egress (data not shown). This normal equilibrium among the infected RBC hosting different intra-parasitic loads observed in HbAA and HbAS con- trasted with the static proportions of the sub-populations among the HbSS cultures (Online Supplementary Figure S1B-E) observed after 24 h, and suggested a potential inhibitory environment in the HbSS cell may account for the low parasitemia found in HbSS cultures.
Effect of HbSS cell environment on the morphological differentiation of the parasite
As shown above, HbSS RBC did not interfere with the intra-erythrocytic parasite proliferation and differentiation since iRBC were seen carrying high intracellular parasite loads (4N and >4N) right from the first 24 h life cycle (Figure 3A). In addition, the analysis of the sequential appearance of the different morphological stages (light microscopy of Giemsa smears) in the HbAA, HbAS and HbSS cultures confirmed this successful intracellular pro- liferation, and showed that parasite differentiation into the different morphological stages occurred successfully in all three types of cultures (Figure 4). However, closer examination of parasite morphology in HbSS cells revealed some abnormalities. The heterogeneity of the sub-populations of iRBC reported from the FACS analysis of these cultures (Figure 3) was also observed by micro- scopic analysis and can be described as a change in fre- quency of infected RBC hosting different numbers of attached or detached parasites (Figure 4). The predomi- nant parasite stages seen at later time points in sickle cells were of the detached variety and consisted of rings (describes any unattached intracellular parasite) present in single, double, quadruple and multiple forms. Many of the parasites were seen unattached to each other and assumed either circular, pear or deformed shapes (Figure 4). However, there were parasitized RBC that also assumed conventional morphological stages, seen as “paired-fig-
2194
haematologica | 2019; 104(11)
