
Page 87 - 2019_11 Resto del Mondo-web
P. 87
B. divergens infection in HbSS
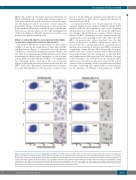
HbSS cells, results in equivalent invasion efficiencies for HbSS and HbAA cells. Additionally, all the parasite cul- tures were followed a few hours later to ensure that para- site development could be recorded to yield comparable parasitemia. Images of invaded parasites can be very easi- ly discriminated from that of the H-J bodies, with the par- asite seen as a distinct ring versus the solid staining pattern of the body (Figure 2). Overall, all cells were found to sup- port parasite invasion equally well.
Effect of sickle Hb (HbSS) and sickle trait Hb (HbAS) on the intra-erythrocytic parasite development
The relative differences in parasitemia in the cultures (Tables 1-3) and in the distribution of their infected RBC sub-populations (Figure 3) described not only parasite competence for population expansion in that cell type, but also their developmental and differentiation status when monitoring the chronological emergence of each sub-par- asite population within the infected RBC. The supplemen- tary histogram peaks detected at 24 h post invasion (Figure 3) indicating parasite proliferation showed that the HbSS sickle cells, permitted intra-erythrocytic prolifera- tion and differentiation of the parasites; however, they
may not be providing an optimum environment for cul- ture propagation as there was no appreciable increase in parasitemia after 24 h.
As mentioned before, at 1 h post invasion (1 h his- tograms) (Figure 3), all cultures exhibited similar FACS profiles, with the 1N population seen as the dominant sub-population as expected, as shown in the representa- tive samples. The distribution over time of these sub-pop- ulations of iRBC (frequency of events acquired in the his- togram peaks corresponding to 1N-; 2N-; 4N-; and >4N- iRBC sub-populations), when translated into the line charts as presented in Online Supplementary Figure S1, showed that the conventional pattern of population for- mation was adopted by B. divergens in all RBC, irrespective of genotype, during the first 24 h. During this first intra- erythrocytic cycle, with the intense intra-cellular prolifer- ation (characterized by the emergence of infected RBC with higher intra-cellular parasite load) and the low ratio of invasion/egress (as evidenced by the relatively stable culture sizes over 24 h as expected, even for the control cultures) Babesia similarly built its populations in all three cell types, exhibiting the common gain of heterogeneity by the presence of different sub-populations of iRBC.
A
B
CD
EF
Figure 2. Invasion efficiency is similar in HbAA, HbAS and HbSS cells. FACS analysis of DNA content in representative (A,C,E) uninfected red blood cells (RBC) and (B,D,F) infected RBC, along with Giemsa stained smears. (A) HbSS cells reveal DNA positive population (0.1-0.3%) from Howell Jolly (H-J) Bodies in cells, Giemsa image shows a dense H-J body, (marked by asterisk). (C) HbAS cells and (E) HbAA cells do not have DNA positive population and Giemsa smear shows absence of bodies. (B) Parasite cultures in the same HbSS cells show higher Vybrant positive population than uninfected, being composed of both cells containing H-J bodies and parasites. The difference between panels (B) and (A) yields invasion parasitemias (see Table 4 for data). Giemsa smear shows distinct ring formed 1 hour (h) post invasion, presenting a clear difference from H-J body. (D and F) 1 h post-invasion cultures of (D) HbAS cells and (F) HbAA cells showing Vybrant positive popu- lation, and 1 h post-invasion Giemsa image showing newly invaded parasites (marked by arrows).
haematologica | 2019; 104(11)
2193
