
Page 85 - 2019_11 Resto del Mondo-web
P. 85
B. divergens infection in HbSS
cytometry. Sub-populations were identified as a function of the presence and their number of intra erythrocyte parasites / genome (intra erythrocyte parasite load) where “1 N” refers to one genome copy based on the method previously describe.34 The percentage of inhibition mediated by the different Hb genotypes was deter- mined by assuming that the parasitemia from control HbAA cells was equivalent to 0% inhibition or enhancement.
Results
Response of B. divergens to the different host cell hemoglobin environments
To assess the hosting ability of the sickle cell anemia cells, purified merozoite preparations were used to infect HbSS and HbAS RBC from sickle and sickle trait patients, respectively, in parallel with HbAA RBC as wild-type con- trol. Multiple independent experiments were performed with each cell type and processes such as invasion, devel- opment and egress were chronologically observed during the asexual erythrocytic cycle of B. divergens.
The first indication that there were differences in para- site development in the RBC of different Hb genotypes was observed while defining the ideal time points to eval- uate various aspects of the parasite life-cycle (Table 1). A single sample each of HbAA, HbAS and HbSS RBC was used in an invasion assay using purified merozoite prepa- rations. One-hour post-mixing was found to be the ideal time point to evaluate invasion and monitor the initial par- asitemia. At the 5 min time point, the parasitemia was too low to assess differences between the three cell types, although high synchronicity of parasites was achieved. At the 6 h time point, the initial synchronicity was lost by events of late merozoite invasion and the cultures were affected by the long exposure to the ruptured RBC rem- nants that were introduced by the inoculation (data not shown). Because of these factors, 1 h post- mixing of mero- zoite preparations and RBC was used as the time-point to assess invasion in the experiments that followed.
B. divergens was able to efficiently invade RBC of all three genotypes: HbAA, HbAS and HbSS. However, parasite cul- ture expansion was drastically compromised in the sickle cell (SS) environment which can be seen by the comparison of parasitemia progression in the HbSS culture as compared to both HbAS and HbAA cultures (Table 1) (culture growth inhibition of 36%, 59% and 70% respectively at 24 h, 48 h and 72 h post invasion of the HbSS culture when compared to HbAA) (Figure1A). In contrast to the HbSS cultures, HbAS cells were found to provide a favorable environment for parasite progression, with only modest differences in parasitemia observed when compared with the wild-type HbAA (culture growth inhibition of 4.3%, 0% and 1% respectively at 24 h, 48 h and 72 h post invasion of HbAS culture compared to HbAA) (Table 1 and Figure 1A).
HbSS red blood cells from diverse donors exhibit comparable degrees of impairment of parasitemia progression while HbAS red blood cells from diverse donors permit normal parasite progression
To assess the effect of the individual variability in sickle cell anemia and sickle trait RBC from different individuals on the parasite response to these RBC environments, RBC from 11 different sickle cell (Table 2) and five sickle trait (Table 3) patients were infected with purified merozoite preparations. Each experiment was run together with sev- eral wild-type RBC controls (HbAA) originating from dif- ferent individuals. The cultures were monitored from invasion to 48-72 h post invasion.
On monitoring the parasite population sizes over time, it was clear that, although there was individual variation among sickle cells from different sickle cell anemia patients, the HbSS cells in every tested culture did not support nor- mal culture progression, as the parasitemia was drastically reduced in all 11 sickle cell cultures (Table 2). This inhibition of HbSS-culture expansion was statistically significant at 48 h (P<0.05), when HbAA RBC controls exhibited a robust approximately 3-4-fold increase in parasitemia, compared to the HbSS cells which remained static, exhibiting para- sitemia close to the initial starting values. Eight HbSS cul- tures continued to be monitored at 72 h post invasion, to confirm if significant inhibition (P<0.05) was maintained. Inhibition was found to be sustained and, once again, all eight cultures showed a plateau in parasitemia, not appre- ciably changed from their 48 h parasitemia, unlike the HbAA cultures which approach 40-50% parasitemia at 72 h (Table 2). From the perspective of parasitemia progres- sion, there was thus an increased inhibition over time; approximately 73-92% inhibition of growth in HbSS cul- tures when compared to HbAA controls at 72 h (Figure 1B). In contrast, all HbAS cultures were able to reach a similar parasite population size as the control HbAA cultures at 72 h, averaging 45% parasitemia, with no significant varia- tions in parasitemia in individual HbAS donor cells at differ- ent time points (P>0.05) (Table 3). Overall, all parasite cul- tures established in the HbAS-cells exhibited a similar increase in parasitemia when compared to the HBAA con- trol (Tables 1 and 3), indicating the parasites capability for population progression in HbAS RBC, unlike the impaired culture growth phenotype observed in HbSS RBC. Table 4 shows the aggregate values of inhibition of parasite popu- lation progression in the HbSS cells and HbAS cells with reference to the parasitemias in HbAA cells at the three time points tested. Despite the HbSS cells and HbAS origi- nating from diverse donors, the inhibition seen in the HbSS population is significantly higher than that seen in the HbAS population which has close to parasitemia values in the HbAA population, at the 48 h (68% inhibition in HbSS vs. 15% in HbAS) and 72 h (84% inhibition in HbSS vs. 4% in HbAS) time points in culture (P<0.05) (Table 4).
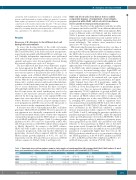
Table 1. Parasitemia assessed from cultures grown in single samples of each hemoglobin (Hb) genotype-HbAA, HbSS, HbAS cultures (5 min-6 hours post inoculation of cultures with free merozoites) and at 24-hour intervals after inoculation (24-72 hours).
Sample 5min 1h 6h 24h 48h 72h
HbAA 0.6 [0.03]
HbSS 0.9 [0.01]
HbAS 0.4 [0.04]
2.1 [0.03]
2.7 [0.02]
2.8 [0.02]
3.0 [0.06]
3.1 [0.06]
3.3 [0.00]
4.7 [0.00]
3.0 [0.00]
4.5 [0.00]
14.4 [0.25]
5.9 [0.06]
15.1 [0.12]
43.2 [0.15]
12.8 [0.10]
42.9 [0.32]
Parasitemia values represent average percentage. [StDv]: Standard Deviation among triplicates; h: hours; min: minutes.
haematologica | 2019; 104(11)
2191
