
Page 86 - 2019_11 Resto del Mondo-web
P. 86
J.R. Cursino-Santos et al.
Similar invasion efficiencies were obtained in HbAA, HbAS and HbSS red blood cells
To understand the specific defect induced in the para- site life-cycle by the sickle environment, the population structure of cultures was analyzed based on the parasite load within the infected RBC (number of parasite genomes by FACS analysis). By monitoring the distribu- tion of sub-populations of infected RBC, the life cycle processes of invasion, parasite development and egress were evaluated in sickle cell anemia compared with sickle trait and control cells.
The invasion of merozoites in all cell types was meas- ured by the percent parasitemia in the different cultures at the 1 h time point, established earlier to be the optimum point to assess invasion efficiency. The sickle RBC were able to support efficient merozoite invasion (HbSS-1 h parasitemia ranged from 0.8% to 2.3%) (Tables 1 and 2). When the invasion efficiency of HbSS RBC was compared
to that of control HbAA RBC, no significant difference in parasite invasion was observed among cultures (P>0.05). In fact, the subtle increase in initial infection rates of HbSS versus HbAA RBC was found to be an artefactual conse- quence of the presence of Howell-Jolly bodies (H-JB) in HbSS cells. These bodies, known as micronuclei, contain small erythrocyte DNA inclusions (approx. 1 mm) that are the consequence of cytogenetic damage.35,36 To confirm that the higher DNA content in infected HbSS cells was indeed from H-J bodies, their quantification was first per- formed by their detailed counts on Giemsa stained smears of uninfected HbSS cells, followed by quantification of DNA content in uninfected HbSS cells (FACS analysis with Vybrant®DyeCycleTMGreen) (Figure 2). Our esti- mates of these bodies in all HbSS samples were in the range of 0.1-0.3% (shown for 3 independent HbSS sam- ples in Online Supplementary Table S1), which when sub- tracted from the parasitemias found for the same infected
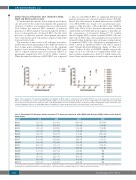
AB
Figure 1. The expansion of B. divergens population was inhibited in HbSS cultures. Comparison of the growth inhibition rate between parasite cultures grown in HbSS cells and HbAS cells relative to growth in wild-type HbAA as measured by parasitemia. (A) Between cultures originating from a single HbSS and single HbAS donor. Values calculated based on data from Table 1. (B) Among HbSS cells from 11 different sickle cell disease patients, showing that, despite variation in para- sitemia in individual cultures, all exhibit high degrees of inhibition of culture progression. Values calculated based on data from Table 2.
Table 2. Parasitemia of B. divergens cultures measured 1-72 hours post-invasion in sickle (HbSS) and wild-type (HbAA) red blood cells from dif- ferent donors.
Sample* 1h 24h 48h#
72h#
37.3 [1.35]
3.9 [0.23] 7.2 [0.21] 9.9[0.10] 43.4 [0.21] 5.5 [0.28] 5.9 [0.00] 49.3 [0.75] 4.1 [0.07] 4.9 [0.12] ND
ND
ND
ND
ND
HbAA-I 1.1 [0.01]
HbSS-1 0.8 [0.03]
HbSS-2 1.5 [0.01]
HbSS-3 1.9 [0.02]
HbAA-II 1.1 [0.03]
HbSS-4 2.0 [0.02]
HbSS-5 1.0 [0.02]
HbAA-III 1.9 [0.02]
HbSS-6 2.3 [0.01]
HbSS-7 2.0 [0.03]
HbAA-IV 1.0 [0.03]
HbSS-8 0.8 [0.03]
HbSS-9 1.5 [0.02]
HbSS-10 1.5 [0.04]
HbSS-11 1.5 [0.01]
4.0 [0.40]
2.3 [0.21]
4.5 [1.18]
5.1 [0.84]
4.1 [1.06]
4.6 [1.56]
3.5 [1.13]
5.5 [0.26]
3.0 [0.00]
3.6 [0.06]
2.9 [0.06]
1.4 [0.10]
2.2 [0.07]
2.3 [0.02]
3.0 [0.35]
14.5 [0.35]
3.4 [0.12]
5.6 [0.12]
8.9 [0.38]
20 [0.92]
5.1 [0.07]
4.8 [0.07]
21 [0.15]
3.5 [0.14]
4.5 [0.20]
12 [0.25]
1.7 [0.12]
4.3 [0.03]
4.0 [0.10]
4.2 [0.15]
*Four independent experiments.(HbSS 1-11) sickle samples (HbAA I-IV) wild-type control samples.Parasitemia values represent average percentage.[StDv]:Standard Deviation among triplicates. #Significant difference between wild-type controls HbAA and tested HbSS samples. P<0.05. ND: not determined; h: hours.
2192
haematologica | 2019; 104(11)
