
Page 181 - 2019_09-HaematologicaMondo-web
P. 181
CD45-negative megakaryopoiesis in the mouse embryo
AC
BF
D
E
G
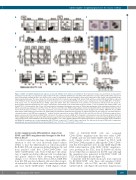
Figure 4. CD45+ and CD45- megakaryocyte subsets are present at E11.5 in the yolk sac and fetal liver. Flow cytometry studies were performed on preparations from E11.5 fetal liver (FL) cell suspensions using Ter119-PerCP.Cy5.5, CD41-PE, CD45-PE-Cy7 and CD42c-FITC antibodies to analyze CD41/CD45/CD42c expression after electronically excluding Ter119+ cells. Fluorescence scales are logarithmic. (A) Representative contour plots of the yolk sac (YS) and FL cell preparations at the indicated gestational ages. The boxes inside the dot plots identify four cell subsets expressing CD45 and/or CD41, which are labeled (R1-R4 and DN) as indicated in the YS E11.5 dot-plot. (B) The bar graphs represent the frequency of each population (R1-R4) as the means ± standard error of mean (SEM) (E9.5, n=6; E10.5, n=8; E11.5, n=9). (C) Acetylcholinesterase (AChE) expression (brown dots) was determined in the purified cell populations indicated from the E11.5 FL. Representative photomicrographs from one of three experiments of hematoxylin-eosin counterstained cells are shown. C+ cells are purified CD9++CD41++CD42c+ cells from E17.5 FL cell suspensions. Bar, 10 μm. (D) Representative histograms showing the expression of CD42c (gray histograms) in the populations defined in (A), in which each point was analyzed at least three times. The fluorescence-minus-one (FMO) isotype signal is shown overlaid (dotted line). The numbers inside the plots represent the frequency of CD42c+ cells in this experiment, representative of three performed with similar results. (E) Expression of NF-E2, VWF, PF4, PU1 and MPO transcripts in cDNA samples from the E11.5 FL CD45/CD41 cell populations purified by flow cytometry as indicated in panel (A). The values for each transcript were calculated relative to the HPRT gene using the 2-DCt method. The bars represent the means ± SEM. R1, n=5; R2, n=4; R3, n=9; R4, n=6. (F) Relative numbers of pro- genitor cells present in the indicated CD45/CD41 cell subsets. The data are means ± SEM. (n=3). Progenitor cell populations were identified as in Figure 3E-F and Online Supplementary Table S1. (G) Clonal differentiation assays. Purified cells from the E11.5 FL populations indicated were seeded in semisolid MegaCult medium (upper graph) and in semisolid MethoCult medium (bottom graph). The colonies grown in MethoCult (erythroid and myeloid colony-forming units: E-CFU and M-CFU) and MegaCult (megakaryocyte colony-forming units: MK-CFU) were counted at 3, 7 and 10 days, respectively. The data are the means ± SEM (n=4). Comparisons among groups were performed with the two-tailed Student t-test. *P<0.05, **P<0.01 and ***P<0.001.
In vitro megakaryocyte differentiation stages from CD45+ and CD45- megakaryocyte lineages in the fetal liver at E11.5
In order to reproduce the steps of megakaryocyte differ- entiation in vitro, we used short-term liquid cultures (STLC) to trace the differentiation of cells from purified R1-R4 E11.5 FL cell suspensions defined in Figure 4A, and from purified adult BM CD41+CD45+CD42c- and CD41++CD45+CD42c+ cells. These STLC have the advan- tage of rapidly producing sufficient cells for phenotypic and genetic analyses while allowing morphological changes to be observed. After 24 h in STLC, EMK (R4) from E11.5 FL produced adherent cells and other elongat- ed and mobile cells which, after 48 h, emitted proplatelets and were CD41++CD45-CD42c++ P-MK (Figures 5A-D).
STLC of R2/CD41+CD45+ cells also contained CD41++CD42c+ megakaryocytes that were either CD45+ or CD45-, and very few CD41+CD45+ cells (3.6% ± 1.5%, n=4). Similar results were obtained in STLC with R3/CD41+CD45- progenitors, although the CD41++CD42c+ cells that developed there were mostly CD45- (Figure 5B). DNA content analysis of the CD41++CD42c++ megakaryo- cytes growing in the STLC from FL R2-R4 cell subsets showed that they accumulated in the 8N stage although the megakaryocytes generated in R4/CD41++CD45- cell STLC reached higher ploidy (Figure 5C).
Consistent with the myelo/monocyte traits expressed by R1/CD41-CD45++ cells, these cells generated CD41- CD45++CD11b++ cells in STLC, and also CD41++CD45+/- CD42c+CD11b- cells (Figure 5B and Online Supplementary
haematologica | 2019; 104(9)
1859
