
Page 179 - 2019_09-HaematologicaMondo-web
P. 179
CD45-negative megakaryopoiesis in the mouse embryo
those in FL are bigger and mostly tetraploid cells, and express higher levels of Runx1, even though they bear less CD41 and CD42c intensity than those in the YS. From E11.5 to E15.5, FL megakaryocytes increase in size, as well as membrane complexity and become CD45+.
Weak CD45 expression in megakaryocyte progenitors in the E11.5 embryo
In the adult BM, all nucleated stages of megakaryocyte differentiation are CD45+.33 Since most megakaryocytes were CD45- at E11.5, we wondered whether megakaryo-
cyte lineage-committed progenitors were also CD45- at these embryonic stages. We therefore determined the number of cells expressing CD45, and the levels of CD45, among LSK, PreMegE, MKP, CMP, GMP and CLP cells (their phenotypes are defined in Online Supplementary Table S1) in E11.5 FL cell suspensions, comparing these with cells from the liver and BM of newborn mice (post- natal day 3, PD3) and from those in the adult BM. The level of CD45 expression was weaker in E11.5 samples than in those from adult mice. Remarkably, both the fre- quency of cells expressing CD45 and the levels of CD45
AB
C
E
DF
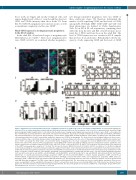
Figure 3. Megakaryocytes and megakaryocyte-lineage committed progenitors are CD45- in the yolk sac and embryo at E10.5-E13.5. (A) Left photomicrograph: the fetal liver (FL) in an embryo preparation stained with anti-CD41 (green) and anti-CD45 (red). The boundaries of the vessel (V) are indicated by the dotted line. Right photomicrographs: higher magnification of cells indicated by the white boxes showing overlaid signals and separated in channels. Green CD41++ cells negative for the red CD45 stain are shown. (B) Yolk sac (YS) and FL cell suspensions from E10.5, E11.5, E13.5 and E15.5 embryos were stained with anti-CD41-PE, anti-CD42c- FITC and anti-CD45-PE-Cy7. The upper-left dot-plot displays a representative CD41/CD42c staining showing the CD41++CD42c+ megakaryocytes and CD41+CD42c- cell populations (labeled as 1 and 2, respectively) analyzed for expression of CD45 in the histograms. The vertical lines in the histograms indicate the fluorescence- minus-one (FMO) isotype control limit. Numbers inside the histograms are the percentages of positive cells. (C) Bar graphs showing the quantification (relative num- ber) of CD45+ cells among the CD41+CD42c- cells and CD41++CD42c+ megakaryocytes. The mean ± standard error of mean (SEM) for E10.5 (n=9), E11.5 (n=9), E13.5 (n=9), E15.5 (n=8), placenta (n=4) and adult bone marrow (BM) (n=4) is shown. (D) CD45 and Runx1 expression analyzed by real-time quantitative poly- merase chain reaction on samples of purified CD41+CD42c- and CD41++CD42c+ cells from the E11.5 YS and FL. The results were calculated relative to the expression of the HPRT housekeeping gene using the 2-DCt method. The data are the mean ± SEM (n=4). Results for total FL at E11.5 are shown as C+. (E) After tracing and electronically excluding Lin+ cells with biotin-labeled antibodies against Ter119, B220, CD19, CD11b and anti-CD90.2 revealed with the fluorochrome-labeled strep- tavidin indicated below, progenitor populations in E11.5 FL and adult BM cell suspensions were identified by multicolor flow cytometry by using combinations of anti- bodies, as follows: (i) anti-Sca1-PE-Cy7, anti-c-Kit-APC, anti-Flt3-PE, and streptavidin-FITC to identify LSK (Lin-c-Kit++Sca1+) cells and common lymphoid progenitors (CLP: Lin-c-Kit+Sca1+); and (ii) anti-c-Kit-APC, anti-CD34-BV421, anti-FcγRII/III-FITC, anti-CD150-PerCp-Cy5.5, and anti-CD41-PE, with anti-Sca1-PE-Cy7 and strepta- vidin-PE-Cy7, to identify granulocyte/macrophage progenitors (GMP: Lin-c-Kit++Sca1-CD34+FcγRII/III++), common myeloid progenitors (CMP: Lin-c-Kit++Sca1- CD34++FcγRII/III-), megakaryocyte/erythroid-committed progenitors (PreMegE: Lin-Sca1-c-Kit+CD150++CD41-) and megakaryocyte progenitors (MKP: Lin-Sca1-c- Kit+CD150++CD41+). CD45 expression was monitored with anti-CD45-APC-Cy7. The histograms show the expression of CD45 by progenitor cells in the E11.5 FL and adult BM (filled gray histograms). The FMO isotype signal is shown overlaid (dotted line). The data shown are from one representative experiment. Fluorescence scales are logarithmic. (F) The quantification (frequency) of CD45+ cells and their mean fluorescence intensity (MFI) in the CD45 channel are shown in the bar graphs. The horizontal dotted line represents the isotype background limit. The data in the graphs are the means ± SEM (n=5), comparing the groups with the two- tailed Student t-test. *P<0.05, **P<0.01 and ***P<0.001.
haematologica | 2019; 104(9)
1857
