
Page 178 - 2019_09-HaematologicaMondo-web
P. 178
I. Cortegano et al.
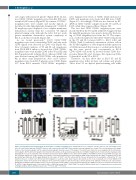
cyte stages with increased ploidy32 (Figure 2B-E). In fact, most CD41++CD42c+ megakaryocytes from E11.5 FL were tetraploid (4N or more) (Figure 2F). By contrast, YS CD41++ megakaryocytes were smaller and mostly diploid, as described for the diploid platelet-forming cells.23 At E10.5, FL megakaryocytes displayed a less complex membrane demarcation system than the concurrent YS diploid platelet-forming cells, although the latter did not reach greater membrane demarcation system complexity at E11.5, as did those from FL (Figure 2D).
As we found previously,28 E11.5 CD41++VWF+ megakaryocytes were consistently CD45-, and only weak CD45 signals were detected in CD41lo cells (Figure 3A). Flow cytometry analyses of YS and FL cell suspensions from E10.5-E15.5 embryos showed that CD41++CD42c+ megakaryocytes were mainly CD45- in the YS and FL until E13.5 (population #1 in Figure 3B-C), whereas CD45+ cells were detected among the CD41+CD42c- cells (population #2) in these same preparations. Also, most embryo megakaryocytes from E11.5 placenta were CD45- (Figure 3C). From E13.5 onwards, CD41++CD42c+ megakaryo-
AB
C
cytes displayed low levels of CD45, which increased at E15.5, and megakaryocytes from adult BM were CD45+ (Figure 3C). Accordingly, CD45 was not detected by RT- qPCR in CD41++CD42c+ samples from the YS and FL at E11.5, while they expressed Runx1 (Figure 3D).
The fact that CD41++CD42c+ megakaryocytes were mostly CD45- in the YS and FL until E13.5 suggested that the initial FL megakaryocytes may be derived by the hom- ing of CD45- megakaryocytes from the YS. The expres- sion of selected markers by the CD41++CD45- cells present in the YS and FL between E10.5 to E11.5 (c-Kit and CD42c) (Table 1) indicated a maturation of these cells in the YS (the brightness of c-Kit dropped and the expression of CD42c increased) that was not so evident in the FL dur- ing the same period, and consequently at E11.5 CD41++CD45- cells in the FL showed weaker CD41 fluo- rescence (Figure 1B), and stronger c-Kit expression (Table 1) than those in the YS at E11.5.
Therefore, our data show that at E11.5 YS and FL megakaryocytes differ in their cell volume and ploidy. Those from YS are diploid platelet-forming cells while
DEF
Figure 2. Topographical and morphological characteristics of embryo megakaryocytes. Immunofluorescence analyses on E11.5 yolk sac (YS) and embryo tissue slices (10 μm) stained with anti-CD41-FITC (green), and counterstained with DAPI. Representative photomicrographs are shown. The scale bar indicates the magni- fication of the photomicrographs. (A) The upper photomicrographs show two views of YS samples. The white boxes define the areas magnified in the bottom pho- tomicrographs. (B) The photomicrographs show fetal liver (FL) samples at the gestational ages indicated. (C) Higher magnification of representative megakaryocytes displaying the increased complexity of the membrane demarcation system (DMS) used to define the Pre-DMS (i), Inter-DMS (ii and iii) and Late-DMS (iv) stages. (D) The bar graph displays the relative number (percentage) of YS and FL megakaryocytes presenting the DMS stages identified in the CD41++ megakaryocytes at the gestational ages indicated. (E) The graph displays the cell volume of CD41++ cells. The volume (πD3x1.33) was calculated after measuring the cell diameter “D”. One hundred cells were counted in 20 different photomicrographs for each time point. Data in panels (D) and (E) are the mean ± standard error of mean (SEM) for YS preparations at E9.5 (n=6), E10.5 (n=9) and E11.5 (n=9), and for FL samples at E10.5 (n=3), E11.5 (n=16), E13.5 (n=9) and E15.5 (n=8). (F) Left, representative histograms showing the DAPI staining in nuclei of electronically gated CD41++CD42c+ embryo-derived megakaryocytes (EMK) present in cell suspensions from YS and FL at E11.5; right, quantification of cells with 2N, 4N or >4N ploidy among CD41++CD42c+ EMK. The mean ± SEM are shown (n=3). Comparisons were performed in contingency tables with χ2 and Fisher exact tests. **P<0.01 and ***P<0.001.
1856
haematologica | 2019; 104(9)
