
Page 177 - 2019_09-HaematologicaMondo-web
P. 177
CD45-negative megakaryopoiesis in the mouse embryo
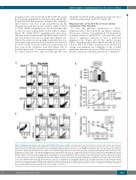
megakaryocytes were detected from E9.5 in the YS, and in the circulating peripheral blood mononuclear cells and the P-Sp/AGM from this moment on (Figure 1A). Similarly, CD41++CD42c+ cells were found from E10.5 in the FL, although the mean fluorescence intensity (MFI) of CD41 in CD41++CD42c+ megakaryocytes was weaker than that at other locations, as particularly evident in E11.5 samples (Figure 1B). CD41++CD42c+ megakaryocytes were more abundant in the YS than in the P-Sp/AGM and FL at E10.5, and their numbers increased along gestation (Figure 1C). Cells in the window corresponding to platelets (low for- ward scatter/side scatter on a log scale) were also detected in the YS and FL from E8.5 and E10.5, respectively, and they were in the circulation from E9.5 (Figure 1D) as described previously.23 Consistent with previous reports,21 the earliest platelets were large and although their size
A
diminished in the YS and FL as gestation progressed, those circulating remain large until E13.5 (Figure 1E).
Megakaryocytes in the E9.5-E11.5 mouse embryo accumulate in the fetal liver
To trace the anatomic distribution of CD41++ megakaryocytes at E11.5 in the YS and embryo, immuno- fluorescence analyses were performed. YS preparations contained clusters of small CD41++ cells that may corre- spond to aggregated platelets, as well as individual megakaryocytes (Figure 2A). In the embryo proper, CD41++ megakaryocytes were enriched in the FL. From E10.5 to E15.5, FL CD41++ megakaryocytes increased in volume and enhanced the complexity of the so-called membrane demarcation system (DMS, involved in pro- platelet formation), indicating maturation to megakaryo-
B
C
DE
Figure 1. Megakaryocyte lineage cells are present from E9.5 in the mouse embryo. Cell suspensions from hematopoietic locations in the embryo were prepared and stained with anti-CD41-PE and anti-CD42c-FITC for cytometry. (A) Representative dot-plots of the staining of cell suspensions from the yolk sac (YS), paraaortic splanchnopleura/aorta-gonads-mesonephros region (P-Sp/AGM), peripheral blood mononuclear cells (PBMC) and fetal liver (FL) at the gestational ages indicated (from E8.5 to E11.5). The quadrants define positive cells (determined by using fluorescence-minus-one control isotypes) and the numbers inside the plots are the frequencies of CD41++CD42c+ cells [mean ± standard error of mean (SEM) n=5, n=6, n=7, and n=16 for E8.5, E9.5, E10.5 and E11.5, respectively]. (B) The bar graphs show the mean fluorescence intensity (MFI) of the CD41 fluorescence among CD41++CD42c+ cells from the locations indicated at E11.5. (C) Absolute numbers of CD41++CD42c+ cells in the YS, P-Sp/AGM and FL from E8.5-E13.5, as derived from the frequencies displayed in the histograms in panel (A) and the total number of cells recovered per organ in each preparation. (D) Representative dot-plots of the CD41 and CD42c staining in cells gated in the low side scatter (SSC)/forward scatter (FSC) window shown in the left dot-plot with the scale FSC as logarithmic, corresponding to platelets. (E) The graph represents the size (determined by the mean FSC channel) of the cells identified in the low SSC/FSC platelet window, in the YS, PBMC and FL from E8.5 to E13.5. The data in the graphs in (B, C and E) are the means ± SEM [numbers as in panel (A), and n=8 and 17 for E12.5 and E13.5, respectively]. Fluorescence scales are logarithmic. The group comparisons were performed with a two-tailed Student t-test. **P<0.01 and ***P<0.001.
haematologica | 2019; 104(9)
1855
