
Page 183 - 2019_09-HaematologicaMondo-web
P. 183
CD45-negative megakaryopoiesis in the mouse embryo
CD45+, indicating that adult megakaryocytes maintain CD45 expression along their differentiation.
In summary, the iAMK and iEMK present among R2/CD41+CD45+ and R3/CD41+CD45- cells produced CD41++CD45-CD42c+ EMK in culture, and in the case of R2/CD41+CD45+ cells also CD41++CD45+CD42c+ AMK, with a characteristic P-MK morphology, while CD41++CD42c+ megakaryocytes growing in BM STLC remained CD45+. Hence, we conclude that in the FL at
A
E11.5, CD45 levels are modulated in the differentiation towards CD41++CD42c+ megakaryocytes.
CD45++CD11b+CD115+ cells can differentiate into intermediate megakaryocyte stages
As expected from their megakaryocyte potential in CFU assays (Figure 4G), CD41-CD45++ cells also differentiated into CD41++CD45+CD42c+ cells, although at the times of analysis they did not undergo great morphological
C
D
BE
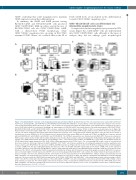
Figure 6. FL CD11b+CD115+ cells have a low megakaryocyte-lineage potential at E11.5. (A) E11.5 fetal liver (FL) cell suspensions were stained with anti-Ter119- PerCP-Cy5.5, anti-CD11b-APC, anti-CD45-PE-Cy7, anti-CD41-PE and anti-CD42c-FITC antibodies. A representative contour plot (upper left) of Ter119- cells (electron- ically excluded) displaying CD11b expression on CD45++ cells is shown. The box inside (R5) shows the CD45+CD11b+ cell population that is analyzed for the expres- sion of CD41 in the bottom left contour plot, identifying cells expressing or not CD41 (R6 and R7 boxes inside the plot). The purified populations of R5/CD45+CD11b+, R6/CD45+CD11b+CD41- and R7/CD45+CD11b+CD41+ cells were cultured in short-term liquid cultures (STLC) for 48 h, recovered and stained as in Figure 5B. Representative contour plots (upper right) of the cells recovered for the STLC performed with R5/CD45+CD11b+ purified cells are shown. The boxes in the plots indi- cate the cell subsets analyzed in the bottom graph, which displays the frequency of the cells grown in STLC from R5, R6 and R7 cells. The data are the means ± standard error of mean (SEM) (n=3). (B) Cell suspensions were prepared from bone marrow (BM) from 2-month old C57BL/6 and MaFIA mice, and were stained with anti-CD45-PE-Cy7, anti-CD41-PE, anti-CD9-APC and CD115-BV605. The C57BL/6 preparations also included an anti-CD42c-FITC. Fluorescence-minus-one (FMO) isotype controls for the CD115 and the CD42c antibodies were included. Representative contour plots display the CD41/CD42c/CD115 (upper plot and his- togram) or the EGFP/CD41 (bottom plot) signals corresponding to CD9+++ cells (left plot) from C57BL/6 and MaFIA mice, respectively. The histogram shows the CD115 signal (filled in gray) displayed by CD9++CD41++CD42c+ BM megakaryocytes from C57BL/6 mice. The corresponding FMO isotype control is overlaid (dotted line). Boxes inside the bottom plot indicate the EGFP- and EGFP+ CD9+++CD41++ cells that were purified by cell sorting and analyzed by real-time quantitative poly- merase chain reaction (RT-qPCR) for the expression of NE-F2 and VWF transcripts as in Figure 4E. The results of the RT-qPCR are displayed in the bottom histograms as means ± SEM (n=3). The upper right graph displays the frequency of the cells in EGFP- and EGFP+ regions (data are the means ± SEM, n=4). (C) The expression of CD115 in E11.5 FL cell preparations from MaFIA mice embryos stained with anti-CD45-PE-Cy7, anti-CD41-PE and anti-CD115-APC antibodies is shown. The quan- tification of the CD115+ cells among the R1-R4 cell populations (identified as in Figure 4A, left dot-plot) is shown in the graph as means ± SEM (n=3). A represen- tative contour plot (right) of CD115 expression on EGFP+ cells on electronically gated R1/CD41-CD45++ cells is shown. The number inside the plot represents the fre- quency of CD115+ cells in the box. (D) Representative contour plots of the FL cell preparations (n =3) from MaFIA mice embryos at E11.5. Electronically selected EGFP+ and EGFP- cells (indicated by boxes inside the plots) were analyzed for expression of CD45 and CD41 by staining with anti-CD45-PE-Cy7 and anti-CD41-PE antibodies. The boxes inside the CD45/CD41 plots indicate the CD45++CD41-, CD45+CD41+ and CD45-CD41++ cells, and the number inside is the percentage of CD45- CD41++ cells. (E) The contour plots show the analyses of the purified EGFP- and EGFP+ cells after sorting (upper contour plots) and after 48 h in STLC (middle contour plots) stained as in panel (D). The bottom graphs represent the frequency of the cell populations identified in the boxes depicted in the CD45/CD41 plots for the EGFP- and EGFP+ cells that were growing in the STLC. Data are the means ± SEM (n=3). All fluorescence scales are logarithmic. Results were compared with the two-tailed Student t-test. *P<0.05, **P<0.01.
haematologica | 2019; 104(9)
1861
