
Page 182 - 2019_09-HaematologicaMondo-web
P. 182
I. Cortegano et al.
Figure S5A). Accordingly, after STLC there was a bias towards myeloperoxidase expression in cultures from R1/CD41-CD45++ cells and towards PF4 in those from R2/CD41+CD45+ cells, R3/CD41+CD45- cells and R4/CD41++CD45- EMK (Figure 5E). The CD41++CD45+CD42c+ megakaryocytes generated in R1/CD41-CD45++ STLC were not elongated nor did they present a P-MK morphology (Figure 5D). Therefore, dur- ing the differentiation to CD41++CD45- megakaryocytes from CD41-CD45++ and CD41+CD45+ cells, a reduction of CD45 levels occurred in conjunction with an increase of CD42c (Figure 5F). Although we found a reduction in the CD45 transcript levels from CD41+CD45+ cells in STLC
(Online Supplementary Figure S5B), to rule out that the decrease in expression of membrane-bound CD45 was due to the use of anti-CD45 for the isolation of the cells, we performed STLC with isolated CD31++CD42c- cells that contained most CD45+/++ cells.28 After 48 h, the CD31++CD42c- cells gave rise to CD42c+ cells that had reduced their CD45 levels (Online Supplementary Figure S5C). By contrast, STLC from CD41+CD45+CD42c- and CD41++CD45+CD42c+ BM-purified cells (Online Supplementary Figure S4D-E) allowed the growth of large cells and P-MK displaying large proplatelets after 96 h, reaching ploidy stages up to 64N. The megakaryocytes (CD41++CD42c+) in these cultures were consistently
AB
D
C
EF
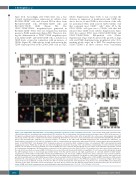
Figure 5. The CD41+CD45- and CD41+CD45+ cell populations from E11.5 fetal liver produce megakaryocytes in vitro. Cells from the CD41/CD45 populations indi- cated in Figure 4A were isolated by flow cytometry from E11.5 fetal liver (FL) cell suspensions, and cultured in short-term liquid cultures (STLC) in the presence of 50 ng/mL recombinant murine thrombopoietin, either in 96-well plates or 8-well culture slides. After 24 and 48 h the cultures were photographed under light microscopy and the cells were counted in function of their morphology. After 48 h the cells were recovered and stained in suspension with anti-CD41-PE, anti-CD45- PE-Cy7 and anti-CD42c-FITC antibodies for cytometry analyses, or stained in the slides with anti-CD41-biotin/Tyr.Cy3 and anti-CD42c-FITC antibodies. (A) Representative contour plots of cells after the sorting procedure for each population are shown in the upper plots. Below-left, a representative photomicrograph (left panel) of R2/CD41+CD45+ cells growing in STLC showing an adherent cell (asterisk, ADH); elongated, mobile cell (arrowhead, EMC); and proplatelet-bearing megakaryocyte (arrow, P-MK). Bar, 10 μm. The bar chart in the right panel shows the frequency of the cells with these morphologies in cultures from the indicated purified cells. The data are means ± standard error of mean (SEM) (200 cells counted in 8-9 photographs for each culture, from 4 different experiments counted by 2 independent investigators). (B) Representative contour plots of the indicated cells after 48 h in culture. The numbers in the plots represent the frequency of the cells in the boxes. Data are means ± SEM, n=4. Fluorescence scales in the plots in panels (A) and (B) are logarithmic. (C) Left, representative histograms showing the DAPI staining in nuclei of electronically gated CD41++CD42c+ from R2 and R4 cultured cells; right, quantification of cells with 2N-16N in CD41++CD42c+ megakaryocytes in 48 h STLC from R2 (white), R3 (hatched) and R4 (black) cells. The means ± SEM are shown (n=5). Group comparisons were performed with the two-tailed Student t-test. (D) Photomicrographs showing CD41 (red) and CD42c (green) staining in cells grown on culture slides (upper panels): bars represent 25 μm (R1, R2 and R4) and 10 μm (R3). White squares indicate the areas amplified in the bottom panels. (E) Expression of PF4 and MPO transcripts in cDNA samples from E11.5 FL cell populations after STLC. The values for each transcript were calculated relative to the HPRT gene using the 2-DCt method as in Figure 4E. The bars represent the means ± SEM. R1, n=5; R2, n=4; R3, n=9; R4, n=6. (F) The horizontal bar chart displays the mean fluorescence intensity (MFI) values obtained by cytometry for the CD45 and CD42c fluorescent labeling of cells after 48 h in cultures from the different subpopulations isolated from the E11.5 FL. The data are means ± SEM, n=4. Group comparisons were performed with the two-tailed Student t-test. *P<0.05, **P<0.01 and ***P<0.001.
1860
haematologica | 2019; 104(9)
