
Page 157 - 2019_09-HaematologicaMondo-web
P. 157
Characterizing energy metabolism of CLL
in Figure 4B). In addition, except for cephaeline, bioener- getic features were more significant than genetic features in the multivariate models (Figure 4C).
Association between clinical course and energy metabolism of chronic lymphocytic leukemia
The use of primary patient cells enabled us to investi- gate the associations between bioenergetic features with patient history or outcome in CLL. In our study cohort, 43 patients had received treatment before sample collection,
in all cases with chemotherapeutic agents (Online Supplementary Table S1), and none of them was undergo- ing treatment when samples were collected. Therefore, we first asked whether these completed treatments prior to sample collection affected the energy metabolism of primary tumor samples, as studies have shown chemotherapy or targeted therapy could drive clonal evo- lution leading to drug resistance or oxidative stress.25-27 We found two bioenergetic features, namely glycolytic capac- ity and glycolytic reserve, associated with pretreatment
A
BC
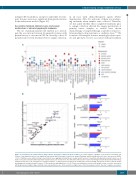
Figure 4. Correlation test results between drug response phenotypes and bioenergetic features. (A) y-axis: negative logarithm of the Pearson correlation test P-values. Only drugs with at least one significant association with bioenergetic features are shown (Benjamini and Hochberg method for false discovery rate (FDR)] = 10%). Viabilities across different drug concentrations were aggregated using Tukey’s median polish method. Correlations with glycolysis-related features are in warm colors and correlations with respiration-related features are in cold colors. The dotted line indicates the P-value threshold given by the Benjamini and Hochberg method for FDR (10%). (B) Comparison of explained variance of drug responses between the multivariate model, including only genetic features, and the model including genetic and bioenergetic features. (C) Red: predictors with significant (<0.05) P-values in multivariate models for the drugs; red bar: a positive association with drug responses (higher drug sensitivity is associated with presence of the mutation or higher value of the bioenergetic feature); blue bar: negative association.
haematologica | 2019; 104(9)
1835
