
Page 156 - 2019_09-HaematologicaMondo-web
P. 156
J. Lu et al.
CLL cells were positively correlated with the viabilities of those cells after drug treatment, while respiration-related features were negatively correlated. This suggests that higher glycolysis activity of CLL cells reduces sensitivity to drugs, while higher respiration activity contributes to increased sensitivity ex vivo. There were more specific pat- terns for drugs with different target profiles. CLL samples with higher respiration activity were more sensitive to kinase inhibitors, including the inhibitors of Bruton’s tyro- sine kinase (BTK), ibrutinib, and of spleen tyrosine kinase, tamatinib, both of which target the BCR pathway. In addi- tion, two checkpoint kinase 1 (Chk1) inhibitors, AZD7762 and PF-477736, and the heat shock protein 90 (Hsp90) inhibitor AT13387 showed similar association patterns, which is in line with the report that they also target the BCR signaling cascade.10
Viabilities after treatment of drugs targeting mitochon- dria-related biological processes (rotenone, venetoclax and navitoclax) were positively correlated with the glycolysis- related features (Figure 4A and Online Supplementary Figure S6) for most of the drug concentrations (Online Supplementary Figure S5); the multivariate test results show that this finding is not merely due to confounding by IGHV status (Online Supplementary Figure S7). Rotenone is a mitochondrial complex I inhibitor, which disrupts the electron transport chain and thus blocks cellular respira- tion. Therefore, the correlation between rotenone response and glycolysis activity can be explained by the fact that higher glycolysis activity or potential (with increased metabolic flexibility) can compensate for cyto- toxic effects of respiration inhibition by providing an alter- native way of producing ATP. Venetoclax and navitoclax
are BH3-mimetics that target the BCL2 protein and lead to mitochondrial damage and the inhibition of oxidative res- piration.23 Thus, lower reliance on oxidative respiration is a plausible explanation for the resistance to BH3-mimetics of CLL cells with high glycolysis activity. We also observed associations between glycolysis-related features and the responses to orlistat, an anti-obesity drug, which has also been identified as a pro-apoptotic agent in CLL by inhibiting lipoprotein lipase (LPL),24 and KX2-391, an inhibitor of the proto-oncogene tyrosine-protein kinase Src (Online Supplementary Figure S6).
We previously showed that although drug response phenotypes of CLL cells were largely influenced by genet- ic variants, there was still substantial variance in the drug response phenotypes that were not explained by genetics. Thus, we asked whether the energy metabolism profile could add additional predictive information. For each drug, we built two multivariate linear regression models to predict its response profile: one included only the 20 genetic features shown in Online Supplementary Figure S2 as predictors, the other included these genetic features plus 11 bioenergetic features. As a measure of predictive strength, we compared the variance explained (R2 value adjusted by numbers of predictors) between the two mod- els. For most drugs, including bioenergetic features in the model did not increase explanatory power (Figure 4B, dots on diagonal line); moreover, responses to individual kinase inhibitors were well explained by the genetic features (blue dots in Figure 4B and Online Supplementary Figure S8). However, for five drugs, including venetoclax and rotenone, the variance explained increased by 10% or more upon inclusion of the bioenergetic features (red dots
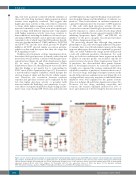
C
AB
Figure 3. Genes from the glycolysis pathway are down-regulated in immunoglobulin variable heavy-chain (IGHV) gene mutated chronic lymphocytic leukemia (M- CLL) samples. (A) Hallmark gene sets that are significantly (10%; Benjamini and Hochberg method for false discovery rate) enriched among genes differentially expressed between M-CLL and unmutated CLL (U-CLL). (B) Heatmap showing z-score of the expression values of glycolysis pathway genes that are differentially expressed between M-CLL and U-CLL samples. (C) Beeswarm plots for the expression values of three key genes in the glycolysis pathway: PFKP (Phosphofructokinase, platelet), PGAM1 (Phosphoglycerate Mutase 1), and PGK1 (Phosphoglycerate kinase 1).
1834
haematologica | 2019; 104(9)
