
Page 158 - 2019_09-HaematologicaMondo-web
P. 158
J. Lu et al.
status at a significance threshold of P<0.05 (Online Supplementary Table S3 and Online Supplementary Figure S9). However, pretreatment status was also highly corre- lated with IGHV (P=0.0006, χ2 test). This reflects the fact that U-CLL patients more frequently receive treatment due to faster progression. Furthermore, glycolytic capacity and reserve are correlated with IGHV status based on our analysis (see above). Thus, to dissect confounding from more direct association, we included IGHV status as a blocking factor in a multivariate model. In this more in- depth analysis, no significant association between pre- treatment status and bioenergetic features was detected (P<0.05). In a second analysis to assess potential roles of pretreatment status on the biology of the tumor samples, we revisited our association tests between the bioener- getic features and: i) the genetic variants; and ii) the drug responses. Including pretreatment status as a blocking fac- tor had negligible impact on directions, strengths and
P-values of these associations (Online Supplementary Figure S10). Together, these results indicate that the treatments experienced by 43 of our patients led to no detectable dif- ferences between the metabolic phenotypes of their circu- lating CLL cell samples and those of the other 97 patients. Therefore, we proceeded with the subsequent analysis using the combined dataset of 140 samples.
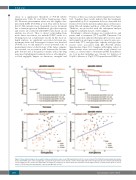
Returning to clinical outcomes, we considered two end points: time to treatment (TTT) and OS. Univariate Cox regression models indicated that glycolytic reserve, maxi- mal respiration, and spare respiratory capacity were asso- ciated with TTT, and glycolytic capacity and glycolytic reserve were associated with OS (P<0.05) (Online Supplementary Figure S11). Samples with higher values of these features were associated with worse clinical out- comes, i.e. shorter time to treatment and OS. In multivari- ate Cox models including age, trisomy 12, deletion of 11q22.3, deletion of 17p13, TP53 mutation and IGHV sta-
AB
C
D
Figure 5. Associations between bioenergetic features and clinical course. (A and B) Kaplan-Meier plots for overall survival (OS) stratified by immunoglobulin variable heavy-chain (IGHV) gene status and glycolytic capacity (A) or glycolytic reserve (B). The cutoff to define high and low bioenergetic groups was estimated by maximally selected rank test. The cutoff value and number of samples in each group are shown inside the parentheses in the figure panels. (C and D) Scatter plots for associ- ations of CD38 expression with glycolytic capacity and glycolytic reserve.
1836
haematologica | 2019; 104(9)
