
Page 159 - 2019_09-HaematologicaMondo-web
P. 159
Characterizing energy metabolism of CLL
tus as co-variates, bioenergetic features were not picked up as predictive for TTT (Online Supplementary Tables S4- S6). However, glycolytic capacity and glycolytic reserve were the most significant predictors for OS also in the multivariate Cox models (Table 1), indicating that these two glycolysis-related features provide additional OS- related information to established variables such as IGHV status, one of the most reliable prognostic markers in CLL. M-CLL patients with low glycolytic capacity or reserve showed best prognosis, U-CLL patients with high gly- colytic capacity or reserve showed worst prognosis, while the other two groups lie in between (Figure 5A and B).
We also investigated associations of each bioenergetic feature to clinically relevant phenotypes including CD38
A
expression, CD49d (IGTA4) expression, and lymphocyte doubling time (LDT), which are considered as indicators for CLL progression.28-31 Again, we considered IGHV status as a potential confounder (Online Supplementary Tables S7 and S8). There were significant correlations between CD38 gene expression with glycolytic capacity and gly- colytic reserve (5% FDR) (Figure 5C and D). As well as the known fact that CD38 expression is highly associated with IGHV status,32 we found that it was positively corre- lated to glycolytic capacity or glycolytic reserve in both M-CLL and U-CLL disease subgroups (Online Supplementary Figure S12). This result suggests an IGHV status-independent link between CD38 activity and adaptability of CLL cells to glycolysis as an energy source.
B
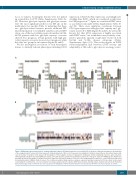
Figure 6. Multivariate regression models for energy metabolism features. (A) Explanatory power (cross-validated R2) of datasets of different data types for the prediction of the energy metabolic features. Error bars represent standard deviations of R2 over 100 repeated cross-validations. Numbers in parentheses after dataset names indi- cate the number of variables in the dataset. (B) Visualization of fitted adaptive L1 (lasso) regularization multivariate models using drug responses, gene mutations, immunoglobulin variable heavy-chain (IGHV) gene status, pretreatment status, and the top 20 principal components of the gene expression (RNASeq) data. Numbers in parentheses indicate the number of samples used for the regression. (Bottom) Scatterplot of Z-scores of the energy metabolic features (i.e. centered by mean and scaled by standard deviation). (Middle) Predictor values. The continuous variables [drug responses and gene expression principal components (PC)] are shown centered and scaled using the red-white-blue color representation, the binary variables (genetic variants, IGHV status) in black and white (black: mutation present). (Left) Horizontal bars show average model coefficients over 100 repeated cross-validations. Only the features that were selected at least 80 times out of 100 repeats are shown.
haematologica | 2019; 104(9)
1837
