
Page 154 - 2019_09-HaematologicaMondo-web
P. 154
J. Lu et al.
AB
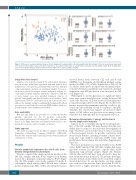
Figure 1. Difference in energy metabolism between chronic lymphocytic leukemia (CLL) cells and normal B cells. (A) Scatterplot of the top two principal components of the 11 tested bioenergetic features. Each dot represents a CLL patient sample (blue) or a healthy-donor derived B cell (red). (B) Beeswarm plots showing differ- ences of six of the bioenergetic features between B-cell samples (n=9) and CLL samples (n=140).
Integrative data analysis
Analyses were performed using R 3.4 and included univariate association tests, multivariate regression with and without lasso penalization, Cox regression, generalized linear models, principal component analysis, and gene set enrichment analysis. For associ- ation tests between bioenergetic features and genetic variants (i.e. copy number variants and gene mutations), only those with five or more variant cases were included. Summary statistics of patients’ demographic and clinical features are provided in Online Supplementary Table S1. All P-values from association tests were adjusted for multiple testing by applying the Benjamini-Hochberg procedure to control false discovery rate (FDR). Further details are provided in the Online Supplementary Methods.
Data availability
Our data and analysis are provided as a reader-reproducible pipeline supported by the R package seahorseCLL (https://github.com/lujunyan1118/seahorseCLL). An online platform based on R Shiny (http://mozi.embl.de/public/seahorseCLL) is also provided for reference and to visualize our dataset.
Study approval
The study was approved by the Ethics Committee Heidelberg (University of Heidelberg, Germany; S-206/2011; S-356/2013). Patients who donated tumor material provided written informed consent prior to study.
Results
Chronic lymphocytic leukemia cells and B cells show distinct energy metabolic phenotypes
We first compared the energy metabolic profiles of the 140 CLL samples and nine B-cell samples from healthy donors. In a principal component analysis (PCA) (Figure 1A), the CLL samples were clearly separated from the B- cell samples, which indicates that CLL cells have a distinct metabolic phenotype. Nine of the 11 bioenergetic features
showed altered levels between CLL cells and B cells (ANOVA test, Benjamini and Hochberg multiple testing method for FDR = 5%) (Online Supplementary Table S2). In accordance with a previous report,6 mitochondrial respira- tion-related features, including basal respiration, maximal respiration, and ATP production were increased in CLL cells (Figure 1B).
With regard to aerobic glycolysis, no significant differ- ences were seen in basal glycolysis activity between CLL and B cells. However, CLL cells showed elevated glycolyt- ic capacity and glycolytic reserve (Figure 1B). As these two features measure the maximum capability of cells for gly- colysis and the flexibility of cells to respond to energetic demands, this observation suggests an increased adapt- ability of CLL cells to use glycolysis as an energy source when needed, although they do not primarily rely on it.
Molecular determinants of energy metabolism in chronic lymphocytic leukemia
Figure 1 shows a variability among the bioenergetic pro- files of the CLL samples. We hypothesized that this vari- ability may be related to the molecular heterogeneity of CLL.8,9 Therefore, we tested the tumor-to-tumor variations of the bioenergetic features for possible correlations with 20 molecular features, including recurrent somatic muta- tions and copy number variations, IGHV status and methylation clusters (Figure 2A and Online Supplementary Figure S2).
The most prominent association identified was IGHV status: IGHV mutated CLL (M-CLL) samples had lower glycolytic activity and glycolytic capacity than IGHV unmutated CLL (U-CLL) samples (Figure 2B). Patients with M-CLL and U-CLL have been observed to have dis- tinct serum metabolite profiles; U-CLL patients have high- er lactate level in serum, which can be considered a sign of elevated glycolysis.7 To our knowledge, our large sample size study provides the first direct proof that U-CLL do indeed have a higher glycolytic activity than M-CLL.
1832
haematologica | 2019; 104(9)
