
Page 153 - 2019_09-HaematologicaMondo-web
P. 153
Characterizing energy metabolism of CLL
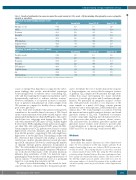
Table 1. Results of multivariate Cox regression model for overall survival (n=119, events =18) by including either glycolytic reserve or glycolytic capacity as a predictor.
Multivariate Cox model including glycolytic reserve
Factor P
Glycolytic reserve 0.033
U-CLL 0.095 Treatment 0.206 Trisomy12 0.265 Age 0.413 TP53 mutations 0.504 11q22.3 deletions 0.629 17p13 deletions 0.790 Multivariate Cox model including glycolytic capacity
Factor P Gycolytic capacity 0.046
U-CLL 0.101
Treatment 0.178
Trisomy12 0.312
TP53 mutation 0.469
11q22.3 deletions 0.494
Age 0.546
17p13 deletions 0.644
Hazard Ratio
1.10
3.00 2.50 2.40 1.20 1.60 0.71 0.80
Hazard Ratio
1.10
2.90 2.60 2.20 1.70 0.61 1.10 0.68
Lower 95% CI
1.00
0.83 0.61 0.52 0.79 0.42 0.17 0.16
Lower 95% CI
1.00
0.81 0.65 0.48 0.42 0.15 0.76 0.13
Upper 95% CI
1.20
11.00 9.90 11.00 1.80 5.90 2.90 4.00
Upper 95% CI
1.10
10.00 10.00 9.70 6.50 2.50 1.70 3.60
CI: Confidence Interval; U-CLL: chronic lymphocytic leukemia cells with unmutated IGHV genes.
source of energy.4 This hypothesis is supported by subse- quent findings that aerobic mitochondrial respiration results in high levels of oxidative stress of circulating CLL cells5 and that targeting the respiratory machinery can be therapeutically exploited to achieve selective toxicity.6 However, Maclntyre et al. reported increased concentra- tions of pyruvate and glutamate in serum samples from CLL patients as compared to healthy donors, which sug- gests active glycolysis.7
It has been well established that genetic heterogeneity contributes to the variable clinical outcomes of CLL. Based on the somatic mutation status in the variable regions of the immunoglobulin (Ig) heavy chain (IGHV) genes, CLL can be divided into two subgroups with distinct prognosis: CLL cells with unmutated IGHV genes (U-CLL) display higher B-cell receptor (BCR) signaling activity and are more aggres- sive than CLL cells with mutated IGHV genes (M-CLL). Serum samples from U-CLL patients were found to contain higher levels of lactate, fumarate, and uridine than those from M-CLL patients,7 suggesting U-CLL cells might have higher rates of aerobic glycolysis. This finding is in line with the observation that normal B cells undergo a metabolic switch from oxidative phosphorylation towards glycolysis upon BCR stimulation.4 However, considering the number of clinically relevant genetic alterations documented in CLL,8,9 the relationship between genetic heterogeneity and energy metabolism remains largely unexplored. Our previ- ous work showed that many of the recurrent mutations influence drug sensitivities of CLL.10 As metabolic repro- gramming has been shown to affect drug responsiveness of various cancers,2,11,12 metabolism may serve as a promising target for overcoming drug resistance in CLL.
To gain a better understanding of the metabolic land- scape of CLL tumor cells in relation to their genetic profile,
and to determine the role of metabolism in the response to drug treatments, we assessed the bioenergetic features of primary CLL samples (n=140 patients) through extra- cellular flux assays investigating two major metabolic processes: 1) aerobic glycolysis; and 2) oxidative phospho- rylation. We performed an integrative analysis of these data with previously recorded ex vivo responses of the same samples to a panel of 63 drugs, somatic genome mutations, tumor transcriptomes, DNA methylomes, and clinical data.10 We found multiple associations between the mutational status and bioenergetic features, and found glycolysis activity of CLL cells contributed to resistance towards compounds targeting mitochondria-related bio- logical processes that include rotenone, orlistat, veneto- clax, and navitoclax. In addition, glycolytic capacity and glycolytic reserve features were shown to provide addi- tional information to known genomic markers, such as IGHV and TP53, for predicting overall survival (OS).
Methods
Extracellular flux assays
Extracellular flux analyses (illustrated in Online Supplementary Figure S1) were performed on 152 CLL samples and nine B-cell samples from healthy donors on a Seahorse XFe96 system as pre- viously described.13 The resulting data files (*.asyr) were converted to comma-separated value (CSV) files using the Wave Desktop software package (Agilent/Seahorse Bioscience) and imported into R for quality assessment and further analysis. The data for 140 of the 152 CLL samples passed quality control and were used for subsequent analyses. A detailed description of the workflow and criteria for quality control are provided in the Online Supplementary Methods.
haematologica | 2019; 104(9)
1831
