
Page 66 - 2019_04-Haematologica-web
P. 66
L. Václavu° et al.
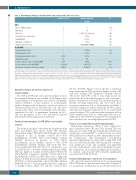
Table 2. Neuroimaging findings in healthy controls and patients with sickle cell disease. Controls (n=11)
MRAa
Circle of Willis variantb Hypoplasiac
Stenosisd
Aneurysms (no. of patients)e Infundibulumf
Moyamoya / collateralsg
Tortuous/curved vessels
FLAIR MRI
Lacunar infarcts, n(%) Cortical infarcts, n(%) Periventricular infarcts, n(%) Total lesion count
Lesion count per subject, median [IQR]
Lesion volume, median mL [IQR]
Prevalence of lesions (>1 lesion, >5 mm)
P++
0.54 0.07 0.42 0.42 0.42 0.58 0.32
0.19 0.42
0.27*
0.03 *
0.02
1 7 0 0 0 0 0
0
0
1(9%)
83
1 [8]
0.02 [0.28]
5 (45%)
Patients with SCD
(n=36)
6
12
2 (25-50%, occlusion) 2 (6%)
2 (6%)
1 (3%)
3 (ACA, MCA, PCOM)
5 (14%) 2 (6%) 1(3%) 386
5 [15]
0.34 [1.56]
29 (81%)
++Chi-square test. * Wilcoxon rank sum test. aNormal MRA: normal defined as full Circle of Willis, excludes anatomic variants and hypoplasia. bVariant MRA: anatomic variant of the circle of Willis such as absence of a PCOM, a fetal variant PCA, non-fusion at origin of vertebro-basilar artery, early branching of a distal artery. cHypoplasia: diameter <1 mm forPCOM,ordiameter<2mmforACA.dStenosis:(i)<25%;(ii)25-50%,(iii)50-75%,(iv)75-99%,(v)occlusion.eAneurysm:numberofpatientsaffectedbyaneurysms.fInfundibulum: dilatational widening of the origin of a junctional artery. gMoyamoya syndrome: bilateral occlusion of the terminal portion of ICA or proximal MCA, with abnormal vascular net- works (collaterals) in the vicinity of the occlusive lesions. MRA: magnetic resonance angiogram; FLAIR MRI: fluid attenuation inversion recovery magnetic resonance imaging; SCD: sickle cell disease; ACA: anterior cerebral artery; MCA: middle cerebral artery; PCOM: posterior communicating artery; IQR: interquartile range.
Dynamic cerebral blood flow response to acetazolamide
The CBF and CVR time-series plotted in Figure 2 show that maximal dilatation was reached 10-15 minutes after acetazolamide in both patients and controls. All healthy subjects exhibited a robust response to acetazolamide without changes in blood pressure or heart rate (data not shown) measured before and after the scan. The most common side-effects after acetazolamide were dizziness, experienced by 26% of participants, headache in 13%, and also paresthesia in 13%. No side-effects required intervention (Online Supplementary Table S1).
Cerebral hemodynamics in SCD differ from healthy controls
The boxplots in Figure 3 show that the 36 patients with SCD had higher gray matter (GM) CBF (median [interquartile range]: 82.8 [20.1] mL/100g/min) at baseline compared to the 11 healthy controls (51.3 [4.8] mL/100g/min, P<0.001). After acetazolamide, median GMCBF increased in patients to 108.3 [25.9] mL/100g/min, and in healthy controls to 85.5 [10.8] mL/100g/min, P<0.001. Patients with SCD had 49% lower median GM CVR (34.1 [33.4] %) compared to con- trols (69.5 [32.4] %, P<0.001). Median white matter (WM) CBF was higher at baseline in SCD patients (39.6 [10.9] mL/100g/min) compared to healthy controls (26.5 [3.0] mL/100g/min, P<0.001). In WM, there was a significant increase in CBF after acetazolamide in patients with SCD (P<0.001), as well as in healthy controls (P=0.002). Median WMCVR was 41% lower in patients with SCD compared to healthy controls (SCD: 27.1 [16.2]%; controls: 66.1
[37.3]%, P<0.001). Figure 4 shows the the co-registered maps indicating the SCD group had higher average CBF and lower average CVR compared to healthy controls. The lowest GM CVR of 5.2 % was found in the one patient who had comorbid moyamoya, and a low hemo- globin concentration of 6.4 g/dL. The small (n=3) group of patients receiving transfusions, and even fewer (n=1) receiving transfusions but no hydroxyurea, precluded a statistical comparison of these subgroups. However, fewer days since last transfusion appeared to be associated with a trend to higher CVR, as shown in the descriptive table in Online Supplementary Table S2. Additionally, there was no difference in GM CVR between patients receiving hydrox- yurea and those not receiving hydroxyurea (P=0.89).
Factors associated with cerebral hemodynamics
Hematologic parameters (Table 3) were explored for their correlation with CBF and CVR. Resting CBF was inversely associated with age, hemoglobin concentration, erythrocyte count and HbF %, and positively associated with LDH and total bilirubin. After adjustment for multi- ple comparisons, only hemoglobin concentration remained significantly associated with resting CBF. CVR was associated with baseline CBF, hemoglobin concentra- tion, erythrocyte count, and creatinine, and negatively associated with platelet count. After adjustment for multi- ple comparisons, none remained significant. In multivari- ate analysis, only baseline CBF remained significantly associated with CVR (P=0.029).
Cerebral hemodynamics and lesion co-localization
We observed regional variation in the group-averaged WM CVR maps as shown in the lower panel of Figure 4. Co-localization of CVR in lesions are shown by the lesion
694
haematologica | 2019; 104(4)
