
Page 64 - 2019_04-Haematologica-web
P. 64
L. Václavu° et al.
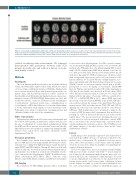
Figure 1. Lesion maps in adult patients with sickle cell disease and healthy controls. Lesions are scaled to local count of participants with a lesion. The local max- imum of 2 lesions were detected in the healthy controls (upper row) and 7 in the SCD cohort (bottom row). Deep white matter, periventricular and border zone regions exhibited the highest probability of lesions. Also note the large posterior infarct in one patient in the bottom row.
cerebral vasodilation with acetazolamide. We compared hemodynamic MRI parameters between adult SCD patients in steady-state and without a history of stroke, with healthy controls.
Methods
Participants
The local Institutional Review Board at the Academic Medical Center, the Netherlands, approved this study, which was carried out in accordance with the Declaration of Helsinki. Adult patients were recruited by their SCD specialist hematologist from the out- patient clinic, and race-and age-matched controls consisted of their healthy non-SCD friends and family. Inclusion criteria were: informed consent, SCD (HbSS/HbSβ0-thalassemia), age (>18), and steady state (absence of an acute SCD-related event 1 month prior to participation). Exclusion criteria were: contraindications to acetazolamide or MRI, clinical history of overt infarct/hemorrhag- ic stroke, brain tumor, brain surgery, or serious neurologic event. Participants were asked to refrain from consuming alcohol and caffeinated drinks on the day of the examination.
Order of procedures
Participants first underwent a blood pressure measurement and blood draw. Subsequently, an intravenous catheter was placed at the site of cannulation for acetazolamide administration during the MRI scan. Blood pressure was measured before and after the MRI and heart rate was monitored continuously during the MRI. Subjects were asked about side-effects afterwards (Online Supplementary Table S1).
Biological parameters
Blood samples were drawn from an antecubital vein directly prior to MRI and assessed using standard laboratory procedures. Genotype was confirmed by high-performance liquid chromatog- raphy (HPLC) and DNA analysis. Missing lab data were dealt with by last steady-state observation carried forward. Markers indicat- ing hemolysis were defined as serum levels of bilirubin, reticulo- cyte count and lactate dehydrogenase (LDH).24 In addition, hemo- globin concentration, MCV, HbF%, HbS%, leukocyte count, platelet count, ASAT, ALAT, creatinine and CRP were determined.
MR imaging
We performed 3T MRI (Philips Ingenia) with a 32-channel
receive head coil in all participants. For CBF, a pseudo-continu- ous arterial spin labelling (pCASL) sequence was used with a 2D gradient echo FFE single shot echo-planar imaging (EPI) readout with a TR/TE of 4400/14 ms, FOV 240 x 240 mm, voxel size 3 x 3 x 7 mm, post-label delay 1800 ms, label duration 1800 ms, 19 axial slices, flip angle 90°, SPIR fat suppression, 140 label-control pairs, background suppression, and a total scan duration of 20 min. In addition, we acquired 3D time-of-flight magnetic reso- nance angiography and a 3D fluid-attenuated inversion recovery (FLAIR) sequence for lesion assessment. After 5 min of pCASL, participants received 16 mg/kg acetazolamide (Diamox®, Mercury Pharmaceuticals Ltd., London, UK) with a maximum of 1400 mg. Acetazolamide was dissolved in 20 mL saline (NaCl 0.9%) and injected intravenously at a flow rate of 0.1 mL/s, and flushed with 10 mL saline. Voxel-wise CVR was calculated by: CVR (%) = (ΔCBF)/CBF-PRE x 100%, where ΔCBF represents the average of the first 5 min (CBF-PRE) of the pCASL CBF time- series subtracted from the average of the final 5 min. We looked at gray matter (GM) and white matter (WM) CBF and CVR by applying the subject-specific anatomic masks to each subject’s CBF map. CBF quantification was customized to improve the accuracy of CBF by using a dual compartment flow model incor- porating T1 of blood, measured directly in each subject in the sagittal sinus.25 We also incorporated a labelling efficiency cor- rection based on velocity measured with phase-contrast MRI, and a correction for the arterial transit time, measured with a separate multiple inversion time sequence. The 3T MRI protocol and image analysis is described in more detail in the Online Supplementary Methods.
Lesions
FLAIR images were manually segmented and validated by a neuroradiologist (CBM >20 years of experience), blinded to the medical status of the patient. We quantified voxel-wise preva- lence, subject-wise prevalence, total volume, and total number of lesions. Lesions were defined as multiple (>1) signal hyperin- tensities ≥5 mm in diameter.
These lower limits were chosen to maintain external validity with previous studies in adults with SCD.26–28 Lesion diameter was defined as the maximum length along the major axis of a lesion in 3D. Since the contribution of different types of lesions to specific impairments is not known, we also included the fol- lowing lesions in the total lesion volume calculation: lacunar lesions, defined as round or ovoid subcortical fluid-filled cavi- ties, and cortical infarcts, defined as (fluid-filled) regions of
692
haematologica | 2019; 104(4)
