
Page 65 - 2019_04-Haematologica-web
P. 65
Impaired CVR in adults with sickle cell disease
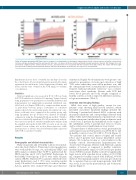
Figure 2. Dynamic gray matter CBF time-course in response to acetazolamide. Acetazolamide administration elicited a robust response in healthy controls (black solid line with grey standard deviations) and patients with sickle cell disease (SCD)(red solid line with pink standard deviations). Absolute CBF changes in the left plot indicate a higher baseline, smaller absolute increase, and slower time to rise in patients with SCD compared to healthy controls. The relative CBF in the right plot show reduced CVR in patients with SCD. Both the CBF and CVR stabilized 10-15 minutes after injection of acetazolamide.
hyperintense necrotic tissue of variable size and shape located in the cortical tissue. A lesion density map was generated by image registration (described in the Online Supplementary Methods) and lesion contours were overlaid on the CVR images to visualize co-localization.
Statistics
Statistical significance was assessed in R 3.4.3 (R Core Team (2017) R Foundation for Statistical Computing, Vienna, Austria) using appropriate tests (parametric for normally distributed and non-parametric for significantly non-normal distributed vari- ables based on a Shapiro-Wilk test) to compare medians, means, or proportions between groups. Scatterplots of correlation analyses show both controls and patients, but exploratory corre- lation coefficients were computed in the patient group only, using Spearman’s rho (ρ). P-values were adjusted for multiple comparisons using the Benjamini-Hochberg method. Variables that were statistically significant (P<0.05) in univariate analysis, were entered as predictor variables in multivariate analysis using the standard enter method with CVR or lesions as an outcome variable. Lesion volume was used in linear regression, while lesion presence or absence was used in binary logistic regression with CVR as a predictor variable.
Results
Demographic and clinical characteristics
Thirty-six patients and 11 healthy controls were includ- ed in the study (Table 1). Patient and control populations were well matched for age, sex, and ethnicity. HPLC and DNA analysis confirmed that 32 (89%) patients had the HbSS genotype and 4 (11%) had HbSβ0 thalassemia. In the healthy control group, 2 (18%) were sickle cell gene carriers (HbAS). Thirteen (37%) patients with SCD were using hydroxyurea and 3 (9%) were receiving regular (every 3-5 weeks) blood transfusions. For those on trans- fusions, patients were studied 3-28 days since their last
transfusion. Regular blood transfusions were given to one patient for prevention of stroke upon detection of high TCD values when they were still in pediatric care, and the other patients were on transfusions for prevention of frequent hydroxycarbamide refractory vaso-occlusive crises/acute chest syndrome. Patients with SCD had lower blood pressure and body weight compared to healthy controls as well as expected differences in hema- tologic measurements (Table 1).
Anatomic neuroimaging findings
MRA data were of high quality, except for two patients’ scans showing small motion artefacts, which precluded assessment. Incidental findings included the following: 1 patient had bilateral MCA occlusions with moyamoya syndrome and corresponding collaterals with diffuse white matter hyperintensity, 2 patients had a total of three aneurysms (smaller than 3 mm in diameter with a wide base), 2 patients had infundibula at the origin of the ophthalmic artery, 3 patients had tortuous vessels, and no arteriovenous malformations were found.
The prevalence of white matter, cortical, periventricular and lacunar lesions in SCD patients was 29/36 (81%) and in healthy controls it was 5/11 (45%), P=0.02 (Figure 1). Two patients had cortical infarct (occipital and frontal lobes) and 5 patients had lacunar (fluid-filled cavity) infarcts. We found no lacunar or cortical infarcts in the healthy controls. Periventricular hyperintensity was observed in both groups. Patients with SCD had a similar number of lesions as compared to healthy volunteers (median [interquartile range] of 6 [19) lesions per patient versus 5 [8.5] lesions per healthy control) but significantly larger lesions with a median lesion volume of 0.34 [1.56] mL compared to healthy controls (0.02 [0.28] mL, P=0.03) (Table 2). The maximum number of lesions per subject in the co-registered lesion count map in patients with SCD was seven, located in the periventricular and borderzone regions (Figure 1).
haematologica | 2019; 104(4)
693
