
Page 56 - 2019_04-Haematologica-web
P. 56
C.J. Mercadante et al.
versus iron within each experimental group harvested at the end of the excretion study at 4.5 months of age. 59Fe and iron levels correlated significantly in all groups (Online Supplementary Figure S2A). The second assump- tion is that 59Fe equilibrates similarly in all mice. To explore this, we examined the relative distribution of 59Fe between Trf+/+ and untreated or treated Trfhpx/hpx mice. Relative distributions correlated more strongly between Trf+/+ and treated Trfhpx/hpx mice than between Trf+/+ and untreated Trfhpx/hpx mice (Online Supplementary Figure S2B). This was not unexpected - treated mutant mice were administered 59Fe after 2 weeks of transferrin treatment during which time hemoglobin and hepcidin levels increased significantly (Figure 1B,C).
To explicitly test 59Fe-based estimates of excretion, we next used 59Fe levels measured during the excretion study to predict urinary iron levels, then measured and com-
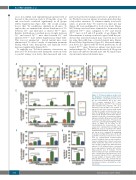
pared actual excreted urinary iron levels to predicted lev- els. We first focused on urinary iron levels given that they solely reflect excretion. To estimate urinary iron levels, values of percent body 59Fe excreted in urine per day (Figure 4F) were multiplied by body iron levels (Figure 5A). Urinary iron levels were estimated to be increased in untreated Trfhpx/hpx mice compared to Trf+/+ and treated Trfhpx/hpx mice at 2.5 and 4.5 months of age (Figure 5E). Measurement of urinary iron levels agreed with the pre- diction that untreated mutant mice excreted more iron via urine than wild-type or treated mutant mice (Figure 5E and Online Supplementary Figure S3). Measured urinary iron levels also agreed with 59Fe-based predictions for all treated Trfhpx/hpx mice. However, urinary iron levels were underestimated by 59Fe-based predictions by 5-10 mg iron per day in all untreated mutant mice and by 2 mg iron per day in female untreated mutant mice.
ABCD
E
Figure 5. 59Fe-based analyses predict rela- tive abundance of urinary iron and fecal fer- ritin in Trf mice. (A, B) Body iron (Fe) levels (A) and concentrations (B) in Trf+/+ mice (‘+/+’, orange), untreated Trfhpx/hpx mice (‘hpx/hpx’, green), and Trfhpx/hpx mice treated with transferrin (TF) (‘hpx/hpx +TF’, blue) harvested at 2.5 months or 4.5 months of age at the end of the excretion study shown in Figure 4. (C) mg Fe excreted per day, calcu- lated by multiplying values in Figure 4E by values in (A). (D) mg Fe excreted per day nor- malized to body size, calculated by multiply- ing values in Figure 4E by values in (B). (E) mg Fe excreted per day in urine. 59Fe-based esti- mates were calculated by multiplying urinary values in Figure 4F by values in (A). Spectrophotometric measurements (‘spec assay’) were calculated by acid digest and BPS-based assay as described in the Online
FG Supplementary Methods. (F) mg Fe excreted per day in feces, estimated by multiplying fecal values in Figure 4F by values in (A). (G) μg ferritin excreted per day in feces meas- ured by enzyme-linked immunosorbent assay. In all panels, data are represented as mean ± standard error of mean; each value shown represents data from at least five mice. In (A-D), at a given age, different letters indicate P<0.05 between values, calculated by one-way analysis of variance with a Holm- Sidak post-hoc test; ‘#’ indicates P<0.05 between values from 2.5- and 4.5-month old mice, calculated by a two-tailed t-test. In (E- G), brackets indicate P<0.05, calculated by one-way analysis of variance with a Holm- Sidak post-hoc test. In (E), asterisks indicate P<0.05 between 59Fe-based and spectropho- tometry-based values, calculated by a two-
tailed t-test.
684
haematologica | 2019; 104(4)
