
Page 55 - 2019_04-Haematologica-web
P. 55
Iron excretion in iron excess
mice. We performed this for 2.5- and 4.5-month-old mice, the respective ages at the beginning and end of the excre- tion study.
We first established body iron levels and concentrations in 2.5- and 4.5-month-old mice (Figure 5A,B). For 2.5- month-old mice, we measured body iron levels and con- centrations in five male and five female mice for each experimental group using the same approach employed for Figure 3. For 4.5-month old mice, we harvested all tis- sues/compartments from mice at the end of the excretion study and measured iron levels and concentrations (Table 1). Iron levels for 2.5- and 4.5-month old mice were con- sistent with iron levels shown in Figure 3 where sexes were pooled (Online Supplementary Figure S1). With body
AB
C
iron levels established in 2.5- and 4.5-month old mice, we next multiplied 59Fe excretion rates (Figure 4E) by body iron levels (Figure 5A) or body iron concentrations (Figure 5B) to estimate iron excretion rates with and without nor- malization to body mass (Figure 5C,D). At 2.5 months, iron excretion rates were predicted to be increased in all Trfhpx/hpx mice except untreated males when not normalized to body size and in all Trfhpx/hpx mice when normalized to body size. At 4.5 months, excretion rates were predicted to be increased in all Trfhpx/hpx mice irrespective of normal- ization to body size.
The above approach involves several assumptions. The first is that 59Fe is fully equilibrated within each mouse. To explore this, we examined the relative distribution of 59Fe
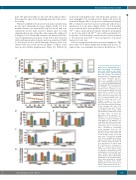
Figure 4. Trf+/+ and treated Trfhpx/hpx mice have similar 59Fe absorption rates and half-lives and excrete iron largely via the gastrointestinal tract. (A) Percent 59Fe absorbed, measured after 59Fe gavage of male and female 2.5-month old Trf+/+ mice (‘+/+’, orange), untreated Trfhpx/hpx mice (‘hpx/hpx’, green), and Trfhpx/hpx mice treated with transferrin (TF) (‘hpx/hpx +TF’, blue) from 2 to 2.5 months of age. Percent 59Fe absorbed was calculated as the sum of body and urinary 59Fe levels expressed as a percent of body, urine, and feces 59Fe levels. (B) Values from (A) normalized to body size. (C) Representative plots of body 59Fe levels from 2.5 to 4.5 months of age in Trf+/+ mice, untreated Trfhpx/hpx mice, and Trfhpx/hpx mice treated with TF from 2 months of age (“hpx/hpx +TF”, blue). ‘Day 0’ indicates the day after 59Fe gav- age. Unfilled circles at day 0 indi- cate that these points were exclud- ed from lines of best fit. Exponential decay equations, 59Fe half-lives (t1/2), and percent 59Fe excreted per day are included in each graph. (D) 59Fe half-lives, cal- culated by exponential decay equa- tions from (C). (E) Percent 59Fe excreted per day, or ‘59Fe excretion rates’, calculated by exponential decay equations from (C). (F) Percent body 59Fe excreted per day via feces or urine in mice from 2.5 to 4.5 months of age. Feces and urine were collected by housing each mouse overnight in metabolic cages at least three times during the excretion study. (G) Sums of fecal and urinary 59Fe values from (F) (“urine+feces”) compared to body 59Fe excretion rates from (E) (“body loss”). In all panels except (C), data are represented as mean ± standard error of mean with each value shown representing data from at least five mice and brackets indicating P<0.05. Statistical signif- icance was calculated by one-way analysis of variance with a Holm- Sidak post-hoc test in (A, B, D, E) and by a two-tailed t-test in (F, G).
DE
F
G
haematologica | 2019; 104(4)
683
