
Page 57 - 2019_04-Haematologica-web
P. 57
Iron excretion in iron excess
We next used 59Fe measurements to investigate fecal 5A). Fecally excreted iron levels were estimated to be iron excretion. To estimate excreted iron levels in feces, increased in all Trfhpx/hpx mice relative to Trf+/+ mice and values of percent body 59Fe excreted in feces per day increased in untreated Trfhpx/hpx mice relative to treated (Figure 4F) were multiplied by body iron levels (Figure Trfhpx/hpx mice for all mice except 2.5-month old male mice
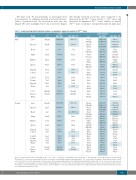
Table 1. Long-term transferrin treatment reduces or normalizes organ iron content in Trfhpx/hpx mice. mme
Sex
Male
Tissue
Liver
Pancreas
Heart
Lungs
Kidneys
Spleen
Stomach S. int. A
S. int. B Cecum Large int. Brain
Pelt Carcass Blood
+/+
164±28
48±18
3±1
29±2
22±5
43±5
13±2 10±1
27±2 7±1 12±1 5±2
244±22 958±97
gFe
hpx/hpx
3208±148
1536±173
9±2
100±8
183±19
88±13
139±6 25±2
97±6 19±2 41±2 47±5
510±25 2130±160
hpx/hpx +TF 1162±127
336±36
5±1 41±9 23±5 66±6
33±2 12±2 15±2 19±3
233±22 828±117
+/+
106±20 (158±22)
162±59 (39±3)
19±3 (155±23)
158±9 (160±10)
38±7 (74±3)
473±60 (441±53)
63±9
44±6 (41±4)
26±3
32±5
37±2
12±6 (16±2)
44±3
55±5 563±29
g Fe/g tissu
hpx/hpx
3406±102 (2344±171)
7110±717 (1924±64)
58±10 (363±29)
676±91 (389±23)
581±75 (496±32)
111±12 (79±6)
1021±53
167±14 (75±9)
144±7
137±9
237±10
123±13 (66±3)
215±12 259±18 191±10
hpx/hpx +TF 750±79
(1751±127)
1042±62 (1207±51)
31±3 (318±9)
215±24 (274±11)
54±12 (219±5)
129±22
30±2 48±6 48±6
50±5 53±8
29±4 18±2
443±26 (259±28)
87±11 (87±6)
45±6 (37±4)
432±35
Female
Liver
Pancreas
Heart
Lungs
Kidneys
Spleen
Stomach S. int. A
S. int. B Cecum Large int. Brain
Pelt Carcass Blood
2817±286
1453±151
8±3
98±11
212±17
93±15
181±7 24±3
108±10 27±4 31±3 43±3
448±23 1913±41
233±25 22±5 2±0
26±2 34±5
30±2 35±5
69±5 72±6
15±1 24±2 8±2
20±1
5±1 7±2
11±1 14±2 7±2 16±2
203±23 199±6 506±50 700±114
1437±125 308±25
3410±337 (2344±171) 7380±590 (1924±64) 53±18 (363±29) 695±83 (389±23) 719±51 (496±32) 150±15 (79±6) 1019±105 179±18 (75±9) 143±12 144±8 184±12 118±9 (66±3) 208±14 277±14 188±11
1159±64 (1751±127) 1109±68 (1207±51)
5±1
215±21 (274±11) 110±12 (219±5)
134±18 80±12 (87±6) 40±7 37±9 60±4
47±1 61±11 460±3
15±2 42±8
196±19 (158±22) 85±11 (39±3) 16±2 (155±23) 162±12 (160±10) 94±7 (74±3) 1029±37 (441±53) 82±8 48±8 (41±4) 22±1 26±3 37±5 16±4 (16±2) 42±5 38±4 471±35
37±4 (318±9)
470±30 (259±28)
40±6 (37±4)
Iron(Fe)levelsweremeasuredin4.5-montholdTrf+/+(“+/+”),Trfhpx/hpx (“hpx/hpx”),andtransferrin(TF)-treatedTrfhpx/hpx (“hpx/hpx+TF”)miceattheendoftheexcretionstudy. TF-treatedTrfhpx/hpx miceweretreatedwithTFfrom2to4.5monthsofage.Digestiveorgansincludingintestines(‘int’.)wereclearedofluminalcontentsbeforeanalysis.‘S.int.A’ refers to the first 4 cm of the small intestine;‘S.int.B’refers to the remaining small intestine.Cells with different shading differ significantly (P<0.05) for a specific organ and sex, as calculated by one-way analysis of variance with the Holm-Sidak post-hoc test. Each value represents the mean ± standard error of mean of the data from at least five mice. For reference, tissue Fe levels from 2.5-month old mice shown in Figures 1 and 2 are included in parentheses; note that parenthetical tissue Fe levels represent data from five mice with males and females pooled.
haematologica | 2019; 104(4)
685
