
Page 115 - 2019_04-Haematologica-web
P. 115
Autophagy drives ETV6-RUNX1-positive leukemia
Results
Vps34 is up-regulated in ETV6-RUNX1-positive BCP-ALL and is induced by the ETV6-RUNX1 fusion protein
To identify novel ETV6-RUNX1 target genes, we com- pared gene expression profiles of primary ALL samples with those of ETV6-RUNX1-transduced umbilical cord blood-derived, healthy CD34-positive hematopoietic pro- genitors (CB-CD34+) (Online Supplementary Figure S1A). Gene expression analysis revealed that 196 genes were differentially expressed in ETV6-RUNX1 transduced CB CD34+ cells in comparison to empty vector controls (2-40 fold; P≤0.05) (Online Supplementary Figure S1B). Ingenuity Pathway Analysis on these 196 genes predicted an inter- acting gene network of 36 genes (Online Supplementary Figure S1C). Analysis of gene ontology (GO) functional categories indicated that ETV6-RUNX1 induced a signa- ture associated with pro-survival and pro-proliferative gene expression and cellular homeostasis (Online
Supplementary Figure S1D and E and Online Supplementary Figure S2A and B).
For the gene expression analysis of primary ALL sam- ples, we used data from cohorts in which ETV6 RUNX1- positive BCP-ALL patients were included26-30 and data from an ETV6-RUNX1 knockdown study performed in a leukemic cell line31 (Online Supplementary Figure S3). Pathway analysis on the top 500 differentially expressed genes in the largest patient cohort (Erasmus MC cohort, 654 ALL patients including 172 ETV6-RUNX1-positive BCP-ALL patients and 401 ETV6vRUNX1-negative BCP ALL patients30) revealed a pro-survival and pro-prolifera- tive signature in ETV6 RUNX1-positive patient cells, sim- ilar to the phenotype predicted in CB-CD34+ cells ectopi- cally expressing ETV6-RUNX1 (Online Supplementary Table S1 and Online Supplementary Figure S2C).
The class III PI3 kinase Vps34 (PIK3C3) was found to be recurrently up-regulated in ETV6-RUNX1-positive ALL patient cells (2.7 fold-higher expression in Erasmus MC
ABC
DE
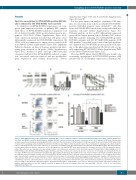
Figure 5. ETV6-RUNX1-positive acute lymphoblastic leukemia (ALL) cells are relatively sensitive to treatment with hydroxychloroquine (HCQ). (A) ETV6-RUNX1-pos- itive (REH and REHS1) and ETV6-RUNX1-negative (NALM6) BCP-ALL cells were cultured in absence or presence of HCQ (6.25 mg/mL) for 48 hours. Western blot analysis was performed using an antibody against LC3B to determine the effectiveness of HCQ treatment. LC3B-I represents the cytosolic form of LC3B, while LC3B- II represents the autophagosome membrane-bound form of LC3B (see also Figure 7). HCQ treatment leads to the accumulation of autophagosomes by blocking the fusion of autophagosomes to lysosomes and hence to an increase in LC3B-II in cells. (B) ETV6-RUNX1-positive BCP-ALL, ETV6-RUNX1-negative BCP-ALL, and T-ALL cell lines were cultured in absence or presence of HCQ (20 mg/mL) for four days. An MTT assay was performed to determine the effect of HCQ treatment on the via- bility of the cells. Data are depicted as the percentage of viable cells compared to untreated control. Error bars represent Standard Error of Mean (SEM) (n=3). (C) ETV6-RUNX1-positive BCP-ALL, ETV6-RUNX1-negative BCP-ALL, and T-ALL cell lines were cultured in absence or presence of increasing concentrations of HCQ for four days. An MTT assay was performed to determine the effect of HCQ treatment on the viability of the cells. A representative experiment is shown in which data are depicted as the percentage of viable cells. (D) Primary ETV6-RUNX1-positive BCP-ALL cells were cultured in absence or presence of 5 or 10 mg/mL HCQ for five days. Flow cytometric analysis was performed to determine the percentage of non-apoptotic (Annexin-V negative, Propidium-Iodide negative, CD19-positive) cells. Representative FACS plots are shown (n=5). (E) Co-culture experiments were performed with primary ETV6-RUNX1-positive BCP-ALL cells and mesenchymal stromal cells (MSCs). Cells were cultured in absence or presence of increasing concentrations of HCQ for five days. Flow cytometrical analysis was performed to determine the percentage of non-apoptotic (Annexin V-negative, Propidium Iodide-negative, CD19-positive) cells. Data are depicted as the relative reduction in survival com- pared to untreated cells (n=6 for HCQ 5 mg/mL and HCQ 10 mg/mL; n=4 for HCQ 20 mg/mL). Error bars represent SEM. *P≤0.05, **P≤0.01. See also Online Supplementary Figure S8.
haematologica | 2019; 104(4)
743
