
Page 116 - 2019_04-Haematologica-web
P. 116
R. Polak et al.
cohort, FDR-adjusted P=7.24E-39) (Figure 1A and B and Online Supplementary Figure S3). To determine the direct effect of the ETV6-RUNX1 fusion protein on Vps34 expression, ETV6-RUNX1 was ectopically expressed in CB-CD34+ cells. Forty hours after transduction, Vps34 mRNA expression was significantly up-regulated by 1.3 fold (P=0.03) (Figure 1D), suggesting a causal relationship between ETV6-RUNX1 and Vps34. Reciprocal experi- ments were performed in ETV6-RUNX1-positive cells (REH cell line and ETV6-RUNX1 transduced CB-CD34+ cells) using siRNAs directed to the ETV6-RUNX1 break- point. Although the ETV6-RUNX1 mRNA levels could only be reduced by 30-35% (P≤0.05) (Online Supplementary Figure S5B), this reduction was sufficient to significantly reduce the levels of Vps34 mRNA and protein both by approximately 40% (P≤0.05) (Figure 1D).
ETV6-RUNX1 and ETV6-RUNX1 target genes enhance Vps34 promoter activity
The upregulation of Vps34 expression in ETV6-RUNX1- positive BCP-ALL patients and ETV6-RUNX1 transduced CB-CD34+ cells, suggests that the Vps34 promoter is acti- vated directly or indirectly by ETV6-RUNX1. Analysis of the Vps34 promoter, using publically available ChIP-seq data, revealed that transcription factors known to play an important role in regulation of hematopoiesis, including
GATA1, GATA2, EGR1 and HEY1, can interact with the Vps34 promoter (Figure 2A). Four of these transcription factors, namely GATA1, GATA2, EGR1 and HEY1, were also found to be up-regulated in ETV6-RUNX1-trans- duced CB-CD34+ cells (Figure 2B and Online Supplementary Figure S1C and Online Supplementary Figure S4). The mRNA expression levels of these four genes were modestly increased in ETV6-RUNX1-transduced CB- CD34+ cells 20 hours after transduction and significantly up-regulated after 40 hours: GATA1, GATA2, EGR1, and HEY1 were up-regulated 3.8-fold (P=0.046), 2.2-fold (P=0.019), 5.0-fold (P=0.004), and 24.9-fold (P=0.015), respectively (Figure 2B).
To investigate the role of ETV6-RUNX1 and the tran- scription factors GATA1, GATA2, EGR1, and HEY1 in reg- ulation of the activity of the Vps34 promoter, luciferase reporter assays were performed using a reporter construct consisting of the Gaussia luciferase gene downstream of a 1.4 kB region (-1383 to +58) of the Vps34 promoter (Figure 2C). Although RUNX1 expression alone was sufficient to induce Vps34 promoter activity (2.4-fold compared to control, P≤0.01), co-expression of its co-factor CBFβ fur- ther enhanced Vps34 promoter activity (4.5-fold com- pared to control, P≤0.05). Similarly, expression of ETV6- RUNX1 was sufficient to induce Vps34 promoter activity (4.2-fold compared to control, P≤0.05), and luciferase
A
BCD
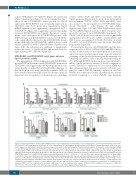
Figure 6. Autophagy inhibition sensitizes ETV6-RUNX1-positive acute lymphoblastic leukemia (ALL) cells to L-Asparaginase. (A) Primary ETV6-RUNX1-positive BCP- ALL cells were cultured in absence or presence of IC 50 concentrations of L-Asparaginase and increasing concentrations of hydroxychloroquine (HCQ). Flow cyto- metric analysis was performed to determine the percentage of non-apoptotic (Annexin V-negative, Propidium Iodide-negative, CD19-positive) cells (for gating strategy see also Online Supplementary Figure S7C). The survival of primary leukemic blasts in the presence of L-Asparaginase was compared to their survival in the absence of L-Asparaginase. White bars represent the relative survival in the absence of HCQ. Gray bars represent the relative survival in the presence of HCQ: 5 mg/mL HCQ (light gray) and 10 mg/mL HCQ (gray). (B) Averages of data presented in (A), representing sensitization of primary leukemic blasts by HCQ to L-Asparaginase (n=5 for ETV6-RUNX1-positive; n=3 for ETV6-RUNX1-negative primary patient cells; *P≤0.05, **P≤0.01, *** P≤0.001). Error bars represent Standard Error of Mean (SEM). (C and D) Co-culture experiments were performed with primary ETV6-RUNX1-positive BCP-ALL cells and mesenchymal stem cells (MSC). Cells were cultured in the presence or the absence of L-Asparaginase and increasing concentrations of HCQ. Flow cytometric analysis was performed to determine the percentage of non- apoptotic (Annexin V-negative, Propidium-Iodide-negative, CD19-positive) cells. First, the survival of primary leukemic blasts in the presence of L-Asparaginase was compared to their survival in absence of L-Asparaginase. Next, data are depicted as fold reduction compared to HCQ-untreated controls (n=5 for conditions in the absence of MSCs, n=7 for conditions in the presence of MSCs for (C), n=3 for conditions in the absence of MSCs, n=4 for conditions in the presence of MSCs for (D). *P≤0.05, **P≤0.01, ***P≤0.001. Error bars represent SEM. See also Online Supplementary Figure S9.
744
haematologica | 2019; 104(4)
