
Page 138 - 2019_02-Haematologica-web
P. 138
S-K. Leivonen et al.
of the signature genes. Re-clustering the data based on the
expression of the 121 genes of the T-lymphocyte signature
separated the patients into three distinct groups with high, intermediate and low expression (Figure 2A and Online Supplementary Figure S1A). Interestingly, patients with low
expression of the T-lymphocyte signature genes (n=12)
had a significantly worse PFS, OS, and DSS in comparison
to patients with intermediate (n=32) and high (n=16) gene
expression (log-rank P=0.041, P=0.009, and P=0.033, respectively) (Figure 2B and Online Supplementary Figure
S2A). In Cox multivariate analysis, low expression of T-
lymphocyte signature had prognostic impact on survival independently of the International Prognostic Index (IPI)
(PFS: HR=2.810, 95%CI: 0.228-6.431, P=0.014; OS:
HR=3.267, 95%CI: 1.406-7.590, P=0.006; and DSS:
HR=2.910, 95%CI: 1.004-8.436, P=0.049). This was evi-
dent for PFS and OS also with the individual IPI factors
(Online Supplementary Table S4). Baseline characteristics,
including age, molecular subgroup, stage, and IPI were
equally distributed in the subgroups with higher and
lower T-lymphocyte signature expression (Online Supplementary Table S5). When the survival analyses were
adjusted according to treatment, adverse prognostic
impact of the low expression of T-lymphocyte signature
on outcome was particularly evident in the patients treat- CD3+CD4+ ed with the rituximab-containing regimen (Figure 2C and
D and Online Supplementary Figure S2B).
At the individual gene level, 72 genes from the T-lym-
3.766 1.225-11.573 CD3+CD8+ 2.738 0.870-8.614
3.957 1.102-14.212
DSS
CD3+ 9.889 1.235-79.200 CD3+CD4+ 9.495 1.186-76.004 CD3+CD8+ 6.512 0.783-54.148
phocyte signature were significantly (P<0.05) associated
with survival in Cox univariate analysis with continuous
variables and had lower expression in the poor prognosis CD3+CD8+ patient group (Online Supplementary Table S6). These
included, for example, T-cell surface markers (CD3D/E/G,
CD4, CD8A/B), cytolytic factors (PRF1, GZMA/K/M),
chemokines (CCL2/3/4/5), and killer-cell lectin-like recep-
tors (KLRB1, KLRG1, KLRK1).
For the Cytokine I signature, no association with sur- Multivariate
Supplementary Figure S1C). This group of patients had shorter survival as compared to patients with higher expression of the signature genes (PFS: P=0.007, OS: P=0.034) (Figure 2F). In a multivariate analysis with IPI, low T-lymphocyte signature remained an independent prognostic factor for PFS (HR=2.560, 95%CI: 1.151-5.695; P=0.021). The baseline characteristics were equally dis- tributed between the patient groups (Online Supplementary Table S5). The results indicate that the T-lymphocyte sig- nature identified from the PTL cohort has prognostic impact on survival also in patients with de novo DLBCL. On the contrary, genes from the cytokine signatures were neither differentially expressed between the patients or associated with survival in DLBCL (data not shown). As in PTL, the absolute expression levels of the cytokine signa-
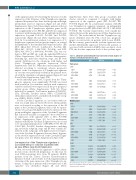
Table 3. Univariate and multivariate Cox regression survival analysis of multiplex immunohistochemistry data.
Univariate
PFS
CD3+ 3.675 1.195-11.299
OS
CD3+ 5.461 1.552-19.214 CD3+CD4+ 4.813 1.355-17.100
HRa 95% CI
P
0.023 0.021 0.085
0.008 0.015 0.035
0.031 0.034 0.083
0.008 <0.001 0.014 0.001 0.073 0.001
0.003 <0.001 0.011 <0.001 0.033 0.001
0.012 <0.001 0.031 <0.001 0.079 <0.001
vival was found (data not shown). However, when patients
were re-clustered according to the expression of the 25
genes of the Cytokine II signature, they could be separat-
ed into two groups with higher and lower expression. The
group with higher expression of the Cytokine II signature CD3+CD4+ had a shorter 5-year PFS as compared to those with low or
PFS
CD3+ 4.706 1.494-14.829 IPI 4.476 1.969-10.174
4.114 1.327-12.755 IPI 4.107 1.797-9.387 CD3+CD8+ 2.861 0.906-9.041 IPI 3.620 1.653-7.928
no expression of the signature (36% vs. 66%; P=0.005)
(Online Supplementary Figure S3). In Cox multivariate
analysis with IPI, the Cytokine II signature was also found
to be an independent predictor of PFS (HR=3.393, 95%CI: 1.531-7.521; P=0.003). Baseline characteristics, including CD3+ age, molecular subgroup, stage and IPI were equally dis-
OS
7.265 2.007-26.302 IPI 5.639 2.382-13.348 CD3+CD4+ 5.244 1.463-18.801 IPI 4.747 2.003-11.250 4.024 1.116-14.512
tributed in the subgroups with higher and lower expres-
sion of the Cytokine II signature (data not shown). In gener-
al, the absolute expression levels of the Cytokine II signa-
ture genes were low (Online Supplementary Figure S1B). CD3+CD8+
Low expression of the T-lymphocyte signature is associated with poor outcome in patients with de novo diffuse large B-cell lymphomas
IPI 4.125 1.816-9.369 DSS
CD3+ 15.219 1.804-128.374 IPI 16.477 4.782-56.777
10.150 1.243-82.889
Next, we tested whether the signatures could be identi-
fied also from other B-cell lymphomas. To this end, we CD3+CD4+
used RNA-sequencing data from 96 primary DLBCL patients from the Cancer Genome Characterization Initiative (CGCI) cohort (Table 1). Following hierarchical clustering of the gene expression of the T-lymphocyte sig- nature, a subgroup of patients with low expression of the signature was identified (Figure 2E and Online
IPI 13.623
CD3+CD8+ 6.744
IPI 11.576
3.987-46.546
0.799-56.923
3.562-37.616
IPI: International Prognostic Index. aHR: hazard Ratio; IPI: International Prognostic Index. CI: Confidence Interval. PFS: progression-free survival; OS: overall survival; DSS: disease-specific survival;
342
haematologica | 2019; 104(2)
