
Page 136 - 2019_02-Haematologica-web
P. 136
S-K. Leivonen et al.
no membranous staining were scored as negative. When deter- mining the triple-positive cases, the highly and moderately pos- itive groups were merged. Scoring was performed independent- ly by MA and SMa.
Multiplex immunohistochemistry (mIHC) using a panel with antibodies for CD3 (clone EP449E, Abcam), CD4 (clone EPR6855, Abcam), CD8 (clone C8/144B, Abcam), CD56 (clone MRQ-42, Cell Marque, Rocklin, CA, USA) was performed as
Table 2. Pathways enriched among T-lymphocyte signature genes. Term
h_thelperPathway:T Helper Cell Surface Molecules
h_tcytotoxicPathway:T Cytotoxic Cell Surface Molecules
h_no2il12Pathway:NO2-dependent IL 12 Pathway in NK cells
h_ctlPathway:CTL mediated immune response against target cells
h_tcraPathway:Lck and Fyn tyrosine kinases in initiation of TCR Activation
h_cskPathway:Activation of Csk by cAMP-dependent Protein Kinase Inhibits Signaling through the T Cell Receptor hsa05150:Staphylococcus aureus infection
h_tcapoptosisPathway:HIV Induced T Cell Apoptosis
hsa04514:Cell adhesion molecules (CAMs)
P
9.74E-04
9.74E-04 0.001542 0.003803 0.013718 0.013718 0.022019 0.028495 0.048673
previously described.14 Further details are provided in the Online Supplementary Methods. The digital image analysis platform CellProfiler 2.1.215 was used for cell segmentation, intensity measurements, and immune cell classification. Marker co-local- ization was computed with the single-cell analysis software FlowJo v.10 (FlowJo LLC.). Spots with less than 5000 cells were excluded from analysis and duplicate spots from the same patient merged.
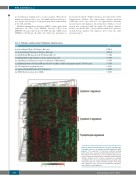
Figure 1. Hierarchical clustering reveals gene signatures dif- ferentially expressed in primary testicular lymphoma (PTL) patients. The expression of PanCancer Immune profiling panel genes was assayed by Nanostring nCounter from 60 PTL samples. The data were z-score transformed and visual- ized by unsupervised hierarchical clustering using Euclidean distance. Relative levels of gene expression are depicted according to the color scale shown. Each row represents a dif- ferent gene and each column a different sample. Three main gene signatures were discovered: T-lymphocyte signature, and Cytokine I and II signatures.
340
haematologica | 2019; 104(2)
