
Page 137 - 2019_02-Haematologica-web
P. 137
Immunoprofiling and survival in PTL
Statistical analysis
Statistical analyses were performed with IBM SPSS v.24.0 (IBM, Armonk, NY, USA). The χ2 test was used to assess differences in categorical variables. Mann-Whitney U and Kruskal-Wallis tests were used to compare differences between two or more groups, respectively. The Kaplan-Meier method was used to estimate sur- vival rates (log-rank test). Cox univariate regression analysis was performed to study the prognostic value of the factors. Multivariate analyses were performed according to the Cox pro- portional hazards regression model using categorical data. Overall survival (OS) and disease-specific survival (DSS) were determined as the interval from diagnosis to death from any cause or death due to lymphoma, respectively. Progression-free survival (PFS) was defined as the period between diagnosis and progression or death from any cause. Correlation analyses were performed with Spearman rank analysis. All comparisons were two-tailed, and P<0.05 was considered significant.
Results
Unsupervised hierarchical clustering reveals genes differentially expressed between primary testicular lymphoma patients
We profiled the expression of 730 immune-associated
genes and 40 housekeeping genes from the FFPE samples of 60 primary testicular DLBCLs utilizing the Nanostring PanCancer Immune Profiling Panel. Unsupervised hierar- chical clustering revealed three gene signatures differen- tially expressed between the patients (Figure 1). We iden- tified a large cluster of genes, which clearly separated the patients. The core signature contained 121 genes (Online Supplementary Table S1), which were enriched for T-cell and NK-cell markers and signaling (e.g. CD3D/E/G, CD4, CD8A/B, ITGB2, PRF1, GZMA/B/H/M/K, KLRB1/G1/K1) (Online Supplementary Tables S1 and S2). This signature was named “T-lymphocyte signature”. In addition, two minor cytokine signatures were recognized. “Cytokine signature I” included 44 genes, enriched for cytokines (e.g. CSF3, CSF2, IL3, IFNA1, IL5, IL11, IL2) (Online Supplementary Table S2), whereas “Cytokine signature II” included 25 genes, enriched for both cytokines and cytokine receptors (e.g. IL4, IL17A, TNFRSF11A, IL17B, TNFSF11, PPBP, IL9, CXCR1, TNFSF18, CCL28) (Online Supplementary Table S3).
T-lymphocyte signature is associated with survival in patients with PTL
To study the association of the gene signatures with sur- vival, we re-clustered samples according to the expression
A
C
E
B
D
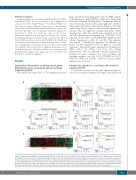
F
Figure 2. T-lymphocyte signature is associated with survival. (A) The gene expression data from 60 primary testicular lymphoma (PTL) patients were re-clustered according to the expression of the T-lymphocyte signature genes. The data clustered into three groups: Group 1: low expression; Group 2: intermediate expression; Group 3: high expression. (B) Kaplan-Meier (log-rank test) survival plots depict progression-free survival (PFS) and overall survival (OS) in the three patient groups. (C and D) Kaplan-Meier plots show the PFS and OS of PTL patients stratified for the treatment with rituximab-containing regimen (C) versus no rituximab (D). (E and F) RNA-seq data from the CGCI cohort with 96 de novo DLBCL cases was clustered based on the T-lymphocyte signature gene expression. This divided the patients into two groups with higher (Group 2) and lower (Group 1) expression (E). Kaplan-Meier plots depict survival differences between the two groups (F).
haematologica | 2019; 104(2)
341
