
Page 49 - 2019_01-Haematologica-web
P. 49
HB9 induces senescence
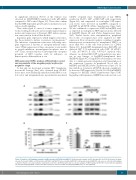
no significant reduction (P=0.1) of the S-phase was observed in HT1080[HB9] transfected with p53-siRNA compared to GFP-control (Figure 3C). These data confirm that the HB9-dependent growth arrest is mediated via acti- vation of p53-signaling.
Thus, with regard to onset of a tumor suppressor net- work, resulting in cell cycle arrest, morphological transfor- mation and expression of SA-β-gal, HB9 induces prema- ture senescence in both cell line models.
In general, gene expression, which triggers senescence, has the potential to initiate or promote carcinogenesis.34 The induction of premature senescence following onco- gene expression is known as oncogene-induced senes- cence.2 While expression of these oncogenes in vitro results in growth inhibition, pre-malignant neoplasias arise in vivo.35 Thus, our next step was to investigate the oncogenic potential of HB9 together with its influence on hematopoietic differentiation in vivo.
HB9-expressing HSPCs undergo differentiation arrest and accumulate at the megakaryocyte/erythrocyte progenitor stage
To this end, we developed a murine HB9+ transplanta- tion model. Lineage– (Lin–) cells, obtained from CD45.2+ donor mice, were lentivirally transduced with HB9 or con- trol vector and transplanted into myeloablative-irradiated
CD45.1+ recipient mice. Transduction of Lin– HSPCs resulted in 15-20% GFP+ or HB9-GFP+ cells, respectively (Figure 4A), and comparable or even higher GFP expres- sion levels were detected in Lin[HB9] compared to Lin[GFP] by qRT-PCR (Online Supplementary Figure S4A). We also confirmed co-expression of HB9 in Lin[HB9], and, as expected, no endogenous HB9 expression was detected in Lin[GFP] (Figure 4B and Online Supplementary Figure S4B). Twelve weeks after transplantation, peripheral blood cells of recipient mice were analyzed for GFP- expression. Flow cytometric analysis confirmed complete hematopoietic reconstitution by transplanted HSPCs, as more than 90% of the cells were positive for CD45.2 (Figure 4C). In Lin[GFP]-transplanted mice (B6[GFP]), we detected GFP+ T, B and myeloid cells (GFP+: 30.1-85.8% T cells, 20.7-69.8% B cells, 8.8-70.2% myeloid cells), whereas no distinct HB9-GFP+ cell population was pres- ent in any lineage of Lin[HB9]-transplanted mice (B6[HB9]) (Figure 4C). Using PCR-based analysis, we were able to confirm genomic integration and transcription of the expression cassettes in peripheral blood cells of B6[HB9] and B6[GFP] (Online Supplementary Figure S5). In line with flow cytometry, qRT-PCR showed a significant- ly decreased GFP-expression (13-fold; P=0.015) in B6[HB9] compared to B6[GFP] (Online Supplementary Figure S5B). Regarding cell frequencies, B6[HB9] mice showed an over-
A
BC
Figure 3. Analysis of p53-pathway activation in HB9-transduced HT1080 and NIH3T3. (A) Western blot analysis of p53, phospho-p53 Ser15 (P-p53) and of its down- stream effector p21 in HB9- or GFP-transduced HT1080 and NIH3T3 cells. γ-irradiated (HT1080) or Etoposide-treated (NIH3T3) cells serve as control for p53 pathway activation. Shown is one representative experiment out of three. (B) Proliferation and (C) cell cycle analysis of HB9-transduced HT1080, treated with non-targeting (nt) and p53-targeting siRNA, compared to GFP-transduced cells treated with non-targeting siRNA (n=3). ns: not significant.
haematologica | 2019; 104(1)
39
