
Page 48 - 2019_01-Haematologica-web
P. 48
D. Ingenhag et al.
HB9 activates the p53-p21 tumor suppressor network
The tumor suppressor p53 plays a prominent role in the G1/S checkpoint control and in the mediation of prema- ture senescence via activation of the cyclin-dependent kinase inhibitor p21.4,30 Therefore, we investigated the p53/p21 status in the HB9 expressing cell line models.
Immunoblotting revealed phosphorylation of p53 at ser- ine 15 upon HB9 expression, indicating activation of the p53-signaling pathway in response to DNA-damage.31 As a result of phosphorylation, p53 accumulates, leading to induction of its downstream mediator p21 (Figure 3A).30,32 Gamma-irradiated HT1080 and Etoposide-treated NIH3T3 cells served as positive control for a DNA-dam-
age dependent p53-pathway activation.31,33 We used a siRNA-mediated p53 knockdown model to determine whether p53 is essential for the HB9-dependent growth arrest. Therefore, HT1080 cells were transfected with p53 or non-targeting siRNA-pools prior to transduction and subjected to proliferation analysis. The siRNA mediated knockdown resulted in a distinct p53 protein reduction for 72 h (Online Supplementary Figure S2), correlating with a reduced pathway activation (Online Supplementary Figure S3). As expected, knockdown of p53 prevented the growth inhibitory effect caused by HB9, as p53-knock- down cells showed a significantly increased proliferation rate compared to non-targeting control (Figure 3B). In line,
A
B
C
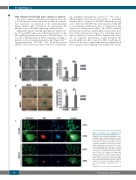
Figure 2. Analysis of the morphology of HB9-transduced HT1080 and NIH3T3 cells. (A) Microscopic analysis regarding the mor- phology of HB9- and GFP-transduced cells (scale bar=50mm). 150 cells were counted from each cell line to determine the per- centage of multinuclear cells (n=3). (B) SA- β-gal staining was performed seven days after transduction. 150 cells were counted each to determine the percentage of β-gal+ cells (n=3). (C) Immunofluorescence stain- ing. F-actin was stained by Phalloidin (shown in green) to detect senescent cell characteristics, such as presence of stress fibers and nuclear actin accumulation. DNA was stained by DAPI (shown in blue). HB9 is shown in red (scale bar=20mm; shown is one representative experiment out of three).
38
haematologica | 2019; 104(1)
