
Page 47 - 2019_01-Haematologica-web
P. 47
HB9 induces senescence
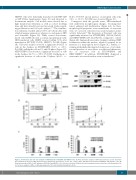
NIH3T3 cells were lentivirally transduced with HB9-GFP or GFP (Online Supplementary Figure S1) and subjected to downstream analysis. Cell models were selected due to high transduction efficiency, as well as a short doubling time, and have already been used in several studies regard- ing proliferation and cell cycle analysis.24-26 The transduc- tion efficiency reached almost 100% in both models with a high transgene expression, whereas no endogenous HB9 was detectable (Figure 1A). While control vector-trans- duced cells ([GFP]) showed a normal exponential growth, HB9-transduced cells ([HB9]) arrested within 72 h after transduction (HT1080: P=0.01; NIH3T3: P=0.05) (Figure 1B). Cell-cycle analysis revealed a significant decrease of cells in the S-phase in HT1080[HB9] (9.6% vs. 4.9%; P=0.005), stalling the cells in G1- and G2-phase (Figure 1C). NIH3T3[HB9] corroborated a significant decrease of cells in the S-phase (12.7% vs. 8.5%; P=0.038). Furthermore, a significant decrease of cells in the G1-phase (61.6% vs.
51.6%; P=0.037) and an increase of aneuploid cells (>4n; 3.4% vs. 13.3%; P=0.002) was observed (Figure 1C).
Contiguous with the growth arrest, HB9-transduced cells underwent morphological changes, becoming flat- tened, enlarged and multinuclear (Figure 2A). As these morphological properties were reminiscent of senescent cells, we assessed senescence-associated β-galactosidase activity (SA-β-gal).27 The frequency of SA-β-gal+ cells was significantly increased in HT1080[HB9] (10-fold; P≤0.01) and NIH3T3[HB9] (133-fold; P≤0.01), compared to control (Figure 2B). Immunofluorescence staining confirmed HB9 localization within the nucleus, which is essential for its function as a transcription factor (Figure 2C). Further, co- staining with phalloidin depicted an increase of cytoskele- ton and presence of stress fibers as additional characteris- tics of senescent cells in HT1080[HB9] and NIH3T3[HB9].28 In addition, HT1080[HB9] displayed a senescence-associated nuclear actin accumulation.29
A
B
C
Figure 1. Proliferation and cell cycle analysis of HB9-transduced HT1080 and NIH3T3 cells. (A) Flow cytometric analysis of GFP-expression was used to determine the transduction efficiency. HB9-expression was analyzed by western blot of non- (nt), control- (GFP) and HB9-vector-transduced NIH3T3 and HT1080 cells. (B) Proliferation study of HB9- or GFP-transduced HT1080 and NIH3T3 cells. Cells were seeded at 24 hours (h) after transduction and counted over a 4-day period (n=3). (C) Cell cycle analysis of HB9- or GFP-expressing cells 72 h after lentiviral transduction (n=3).
haematologica | 2019; 104(1)
37
