
Page 170 - 2019_01-Haematologica-web
P. 170
K. Ishiguro et al.
A
B
C
D
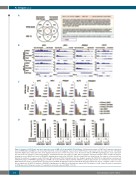
Figure 4. Analysis of H3K79me2 and gene expression levels in MM cells treated with DOT1L inhibitors. (A) Integrated analysis of H3K79me2 and gene expression levels in RPMI-8226 and MM.1S cells treated with SGC0946. Left; Venn diagrams of genes whose H3K79me2 or expression levels were suppressed (> 1.5-fold) by SGC0946. Right; Genes indicated in the Venn diagram shown in boxes of their respective colors. Red letters indicate IRF4-MYC signaling genes. Gene expression was assessed in 2 replicates of microarray analyses, and H3K79me2 was assessed in a single ChIP seq analysis. (B) Representative results of ChIP-seq analyses showing decreased H3K79me2 levels at IRF4-MYC signaling genes induced by SGC0946. Results of input DNA are shown below. The numbers on the vertical axis indicate the numbers of sequence reads. Diff Peak: differential peak; TSS: transcription start site. Regions analyzed by ChIP-PCR are indicated by red arrows. (C) ChIP-qPCR analysis of IRF4-MYC signaling genes in MM cells treated with the indicated DOT1L inhibitors (1 mM, 3 days). Results are normalized to respective input DNAs. Shown are means of 3 replications; error bars represent SEMs. An intergenic region located 28 kb upstream of KLF2 was used as a negative control. *P<0.05; NS: not significant. (D) qRT-PCR analysis of IRF4-MYC signaling genes in MM cells treated with the indicated DOT1L inhibitors (1 mM, 6 days). Results are normalized to ACTB expression. Shown are means of 3 replications; error bars represent SEMs. *P<0.05.
160
haematologica | 2019; 104(1)
