
Page 44 - 2018_10-Haematologica-web
P. 44
V. Lapostolle et al.
A
B
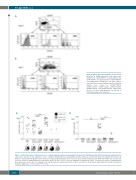
Figure 5. CD133 expression by CD34+ cells selected on the basis of CXCR4 expression. Three gates were delimited: P1, CD34+CXCR4neg cell subpopulation; P2, CD34+CXCR4low cell subpopulation; P3, CD34+CXCR4bright cell subpopulation. Among these cell gates, CD133+ and CD133- fractions were defined and six cell subpop-
sorted as CXCR4negCD133-,
ulations were
CXCR4negCD133+, CXCR4lowCD133-, CXCR4lowCD133+, CXCR4brightCD133-, and CXCR4brightCD133+ subfractions. For each of these subpopulations, the percent of CD133-expressing cells is indicated.
AB
Figure 6. CD133 determines hematopoietic severe combined immunodeficiency repopulating cell capacity of CXCR4-expressing CD34+ steady-state peripheral blood cells, before and after ex vivo expansion. Severe combined immunodeficiency repopulating cell (SRC) activity was evaluated by short-term engraftment (8 weeks) in NSG mice. Each point of the graphs represents the percentage of CD45+ human cells in one mouse bone marrow. (A) Day 0: 1x10⁵ SS-PB total CD34+ cells or 1x10⁵ cells from each sorted cell subpopulation were injected per mouse. (B) Day 7: 2x10⁵ of the total expanded cell population or 2x10⁵ cells from each sorted cell subpopulation were injected per mouse. The “pie” graphs in (A) and (B) show the relative proportions of CD19+ and CD33+ cells pf human origin within the huCD45+ population. Statistical significance: **P<0.01 and ***P<0.001.
1610
haematologica | 2018; 103(10)
