
Page 242 - Haematologica Vol. 107 - September 2022
P. 242
LETTER TO THE EDITOR
A
B
C
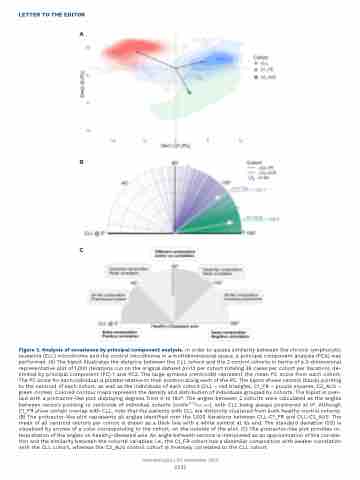
Figure 3. Analysis of covariance by principal component analysis. In order to assess similarity between the chronic lymphocytic leukemia (CLL) microbiome and the control microbiome in a multidimensional space, a principal component analysis (PCA) was performed. (A) The biplot illustrates the distance between the CLL cohort and the 2 control cohorts in terms of a 2-dimensional representative plot of 1,000 iterations run on the original dataset (n=12 per cohort totaling 36 cases per cohort per iteration), de- limited by principal component (PC) 1 and PC2. The large symbols (centroids) represent the mean PC score from each cohort. The PC score for each individual is plotted relative to their position along each of the PC. The biplot shows vectors (black) pointing to the centroid of each cohort, as well as the individuals of each cohort (CLL – red triangles, C1_FR – purple squares, C2_AUS – green circles). Colored contour maps represent the density and distribution of individuals grouped by cohorts. The biplot is over- laid with a protractor-like plot displaying degrees from 0 to 180°. The angles between 2 cohorts were calculated as the angles between vectors pointing to centroids of individual cohorts (cosθ=(a⋅b)⁄(||a|| ||b||)), with CLL being always positioned at 0°. Although C1_FR show certain overlap with CLL, note that the patients with CLL are distinctly clustered from both healthy control cohorts. (B) The protractor-like plot represents all angles identified over the 1,000 iterations between CLL-C1_FR and CLL-C2_AUS. The mean of all centroid vectors per cohort is drawn as a thick line with a white symbol at its end. The standard deviation (SD) is visualized by arrows of a color corresponding to the cohort, on the outside of the plot. (C) The protractor-like plot provides in- terpretation of the angles on healthy-diseased axis. An angle between vectors is interpreted as an approximation of the correla- tion and the similarity between the cohorts’ variables; i.e., the C1_FR cohort has a dissimilar composition with weaker correlation with the CLL cohort, whereas the C2_AUS control cohort is inversely correlated to the CLL cohort.
Haematologica | 107 September 2022
2241
